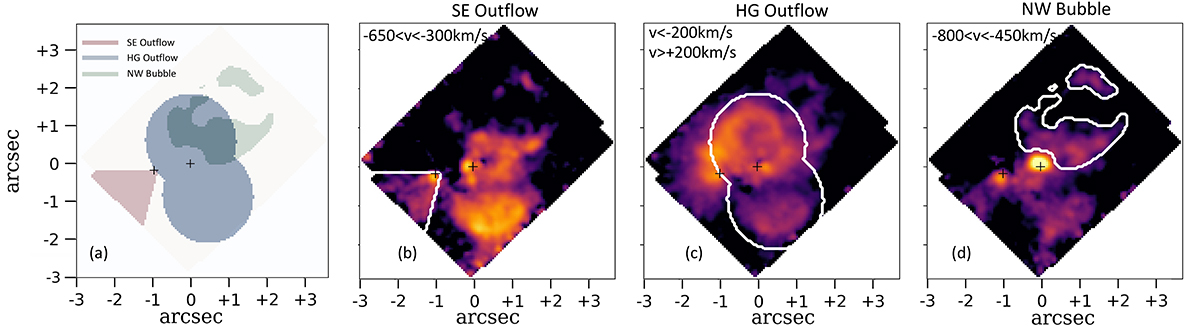
Fig. 5.
Download original image
Arp 220 outflow regions. (a): Composite view of the isolated outflow regions: southeast outflow (red), hour-glass outflow (blue), northwest outflow (green). (b): Channel map between −650 and −300 km s−1 in the H2 transition with respect to the systemic redshift of the E nucleus. The white curve indicates the edges of the SEO mask. (c): Sum of channel maps < − 200 and > 200 km s−1 in the H2 transition with respect to the systemic redshift of the W nucleus. The white curve indicates the edges of the HG region. (d): Sum of H2 and Paα channel maps between −800 and −450 km s−1 with respect to the systemic redshift of the E nucleus. The white curve indicates the edges of the NWB region.
Current usage metrics show cumulative count of Article Views (full-text article views including HTML views, PDF and ePub downloads, according to the available data) and Abstracts Views on Vision4Press platform.
Data correspond to usage on the plateform after 2015. The current usage metrics is available 48-96 hours after online publication and is updated daily on week days.
Initial download of the metrics may take a while.