Fig. 3.
Download original image
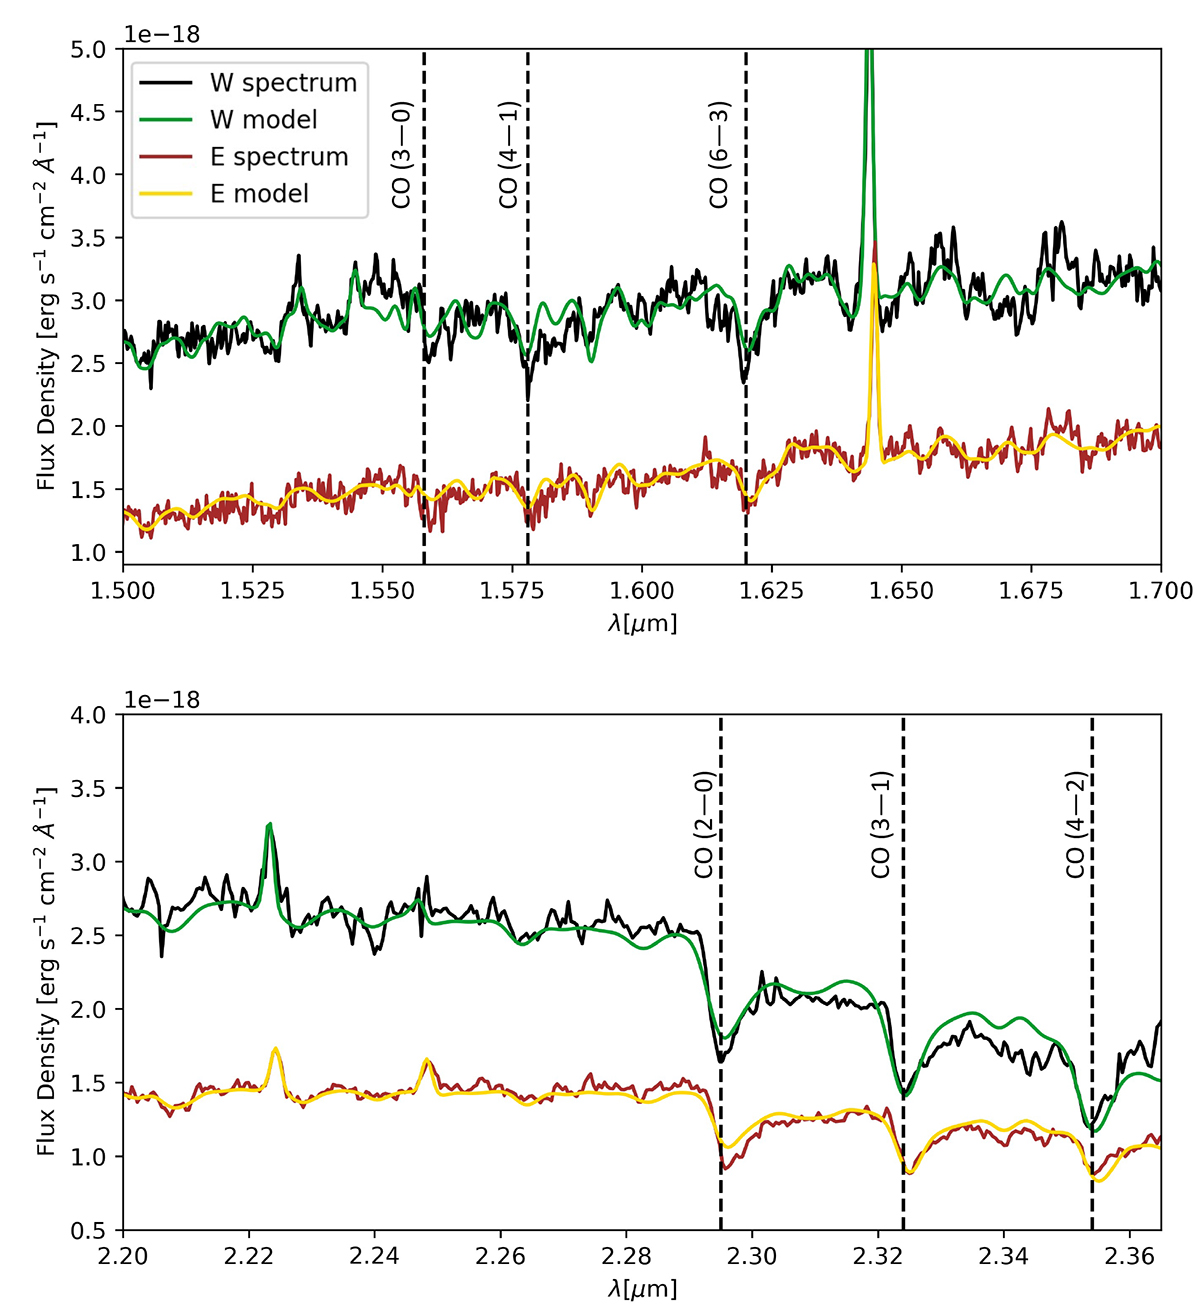
Arp 220 W and E nuclear spectra with pPXF best-fit models. The CO absorption features are in the 1.5–1.7 μm band (upper panel) and 2.2–2.36 μm (bottom panel). Black and green curves respectively refer to the data and the model of the W nucleus spectrum. Brown and gold curves respectively refer to the data and the model of the E nucleus spectrum. Black dashed vertical lines indicate the position of the main CO absorption lines.
Current usage metrics show cumulative count of Article Views (full-text article views including HTML views, PDF and ePub downloads, according to the available data) and Abstracts Views on Vision4Press platform.
Data correspond to usage on the plateform after 2015. The current usage metrics is available 48-96 hours after online publication and is updated daily on week days.
Initial download of the metrics may take a while.