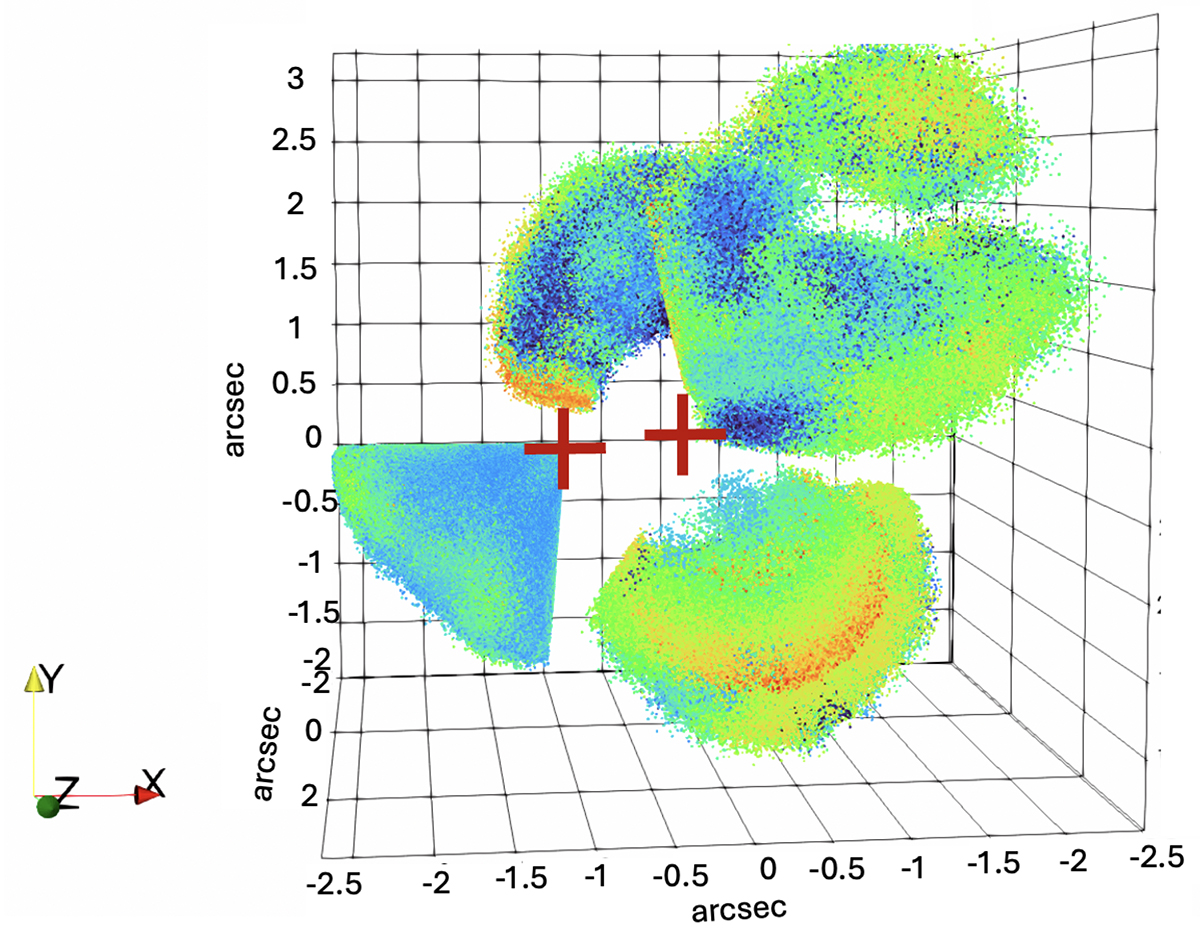
Fig. 20.
Download original image
Three-dimensional representation of the hot molecular outflow structures detected in Arp 220 modeled with MOKA3D. The XY represents the plane of the sky, while the Z axis is the LOS. The color intensity represents the intrinsic cloud emission, bluer colors represent lower emission clouds, while redder colors represent high-emission clouds. (See Marconcini et al. 2023 for the details of the model.)
Current usage metrics show cumulative count of Article Views (full-text article views including HTML views, PDF and ePub downloads, according to the available data) and Abstracts Views on Vision4Press platform.
Data correspond to usage on the plateform after 2015. The current usage metrics is available 48-96 hours after online publication and is updated daily on week days.
Initial download of the metrics may take a while.