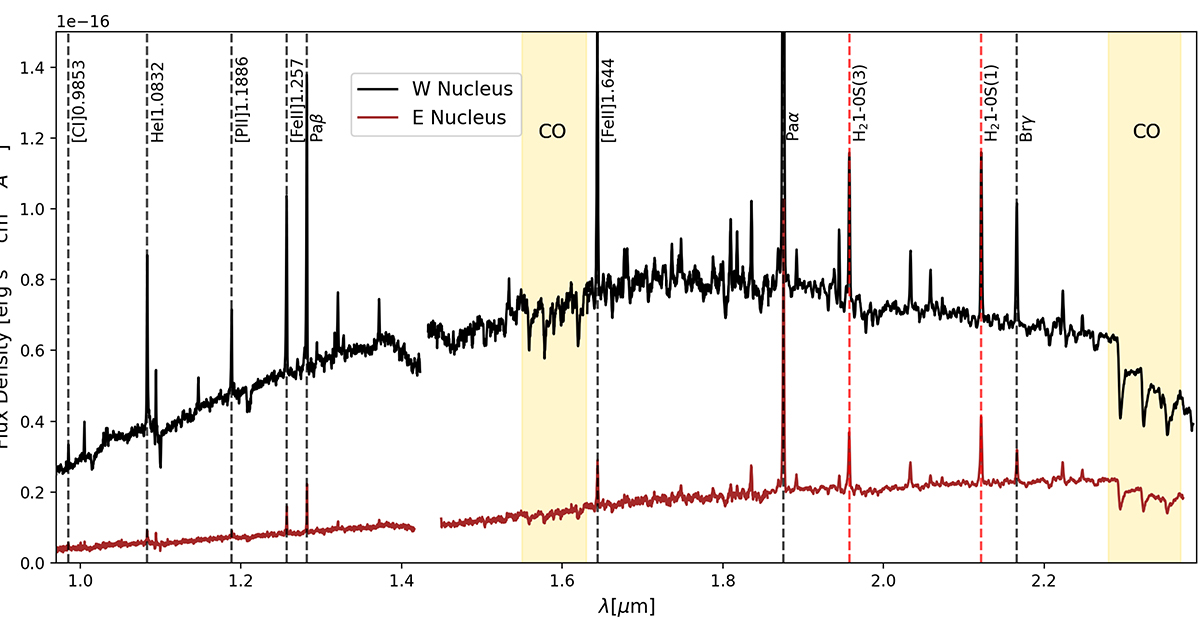
Fig. 2.
Download original image
Arp 220 W and E nuclear spectra. The spectra were extracted from a circular aperture of radius 3 spaxels (corresponding to 0.15″) and are reported in units of flux density as a function of rest-frame wavelength. Red dashed vertical lines identify H2 lines; black dashed lines identify ionized gas transitions. Gold-filled areas mark the position of the main CO stellar absorption lines.
Current usage metrics show cumulative count of Article Views (full-text article views including HTML views, PDF and ePub downloads, according to the available data) and Abstracts Views on Vision4Press platform.
Data correspond to usage on the plateform after 2015. The current usage metrics is available 48-96 hours after online publication and is updated daily on week days.
Initial download of the metrics may take a while.