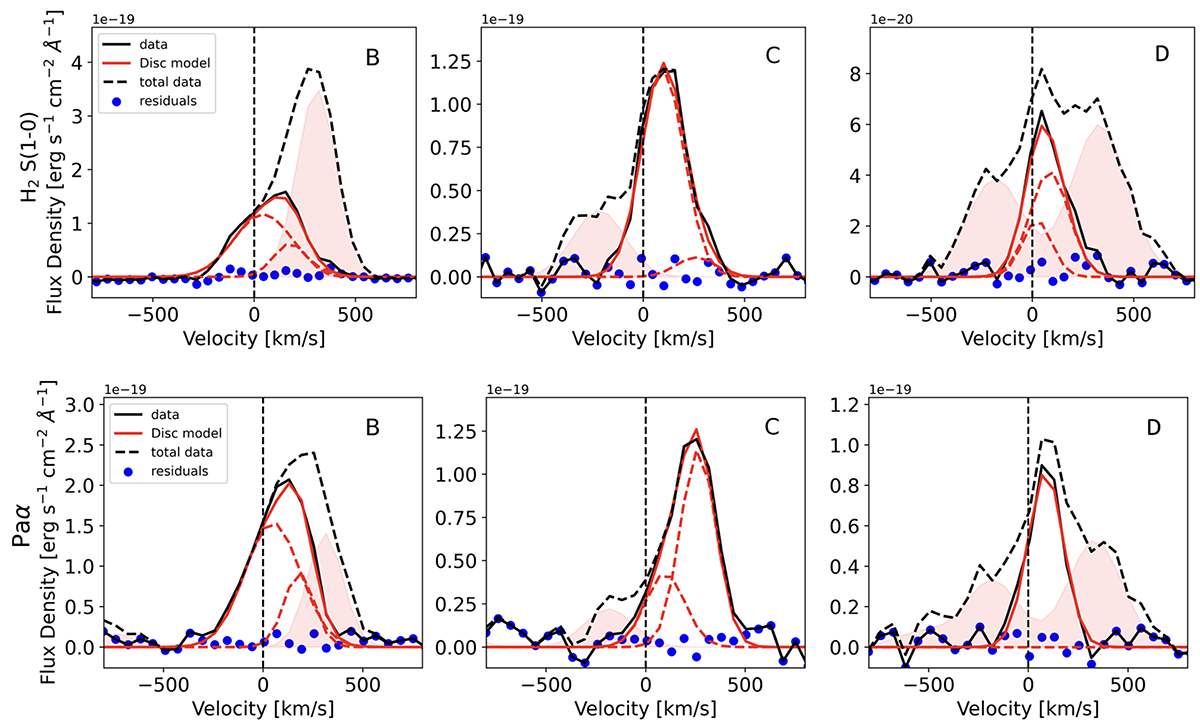
Fig. 14.
Download original image
Spectra extracted from the kiloparsec-scale disk. Line profiles of H2 (top) and Paα (bottom) at the position of the three spaxels labeled in Fig. 12. The black dashed curves represent the spectra from the original cube, highlighting the contribution attributed to the HGO and SEO (red-shaded area) that we have already isolated and subtracted; the black solid lines represent the spectra fitted to identify the large-scale disk. The red dashed curves show the components associated with the disk model. The total disk model is shown with a solid red curve. Velocities are computed with respect to zm.
Current usage metrics show cumulative count of Article Views (full-text article views including HTML views, PDF and ePub downloads, according to the available data) and Abstracts Views on Vision4Press platform.
Data correspond to usage on the plateform after 2015. The current usage metrics is available 48-96 hours after online publication and is updated daily on week days.
Initial download of the metrics may take a while.