Fig. 13.
Download original image
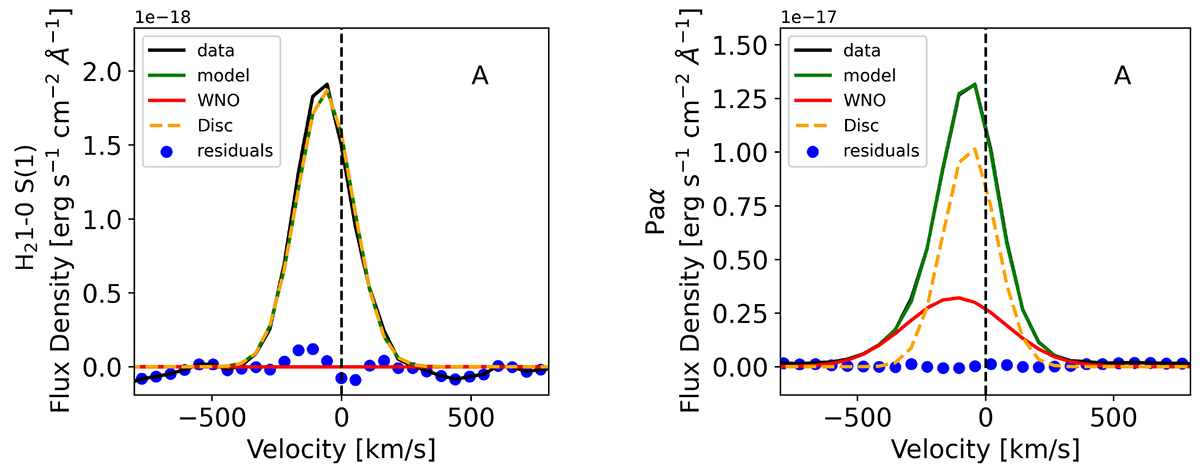
Spectrum extracted from the WNO. Line profiles of H2 (left) and Paα (right) extracted from a spaxel labeled in the bottom panel of Fig. 12). The two component fits are represented by the dashed orange (disc component) and red (outflow component) curves; the combined model is displayed in green. The velocities are computed with respect to the systemic velocity of the W nucleus.
Current usage metrics show cumulative count of Article Views (full-text article views including HTML views, PDF and ePub downloads, according to the available data) and Abstracts Views on Vision4Press platform.
Data correspond to usage on the plateform after 2015. The current usage metrics is available 48-96 hours after online publication and is updated daily on week days.
Initial download of the metrics may take a while.