Fig. 1.
Download original image
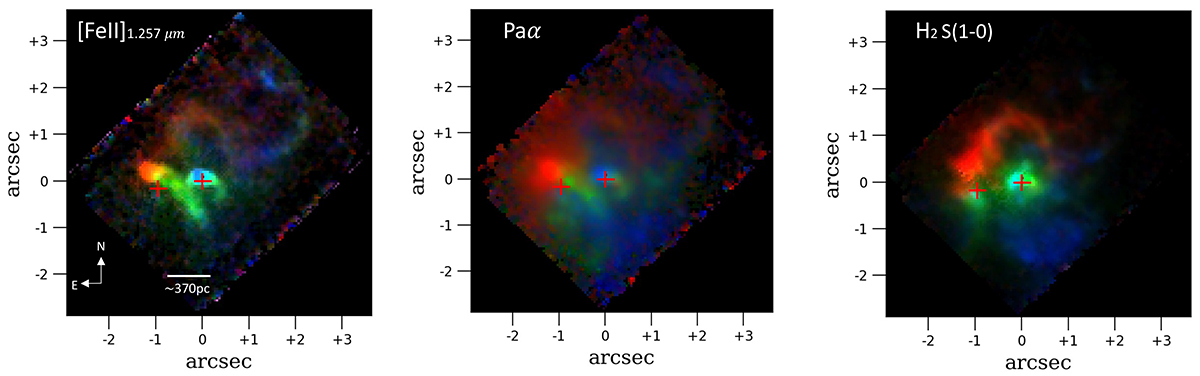
Three-color emission line images of Arp 220. The emission line maps are obtained integrating the continuum-subtracted data-cube around [Fe II] 1.257 μm (left), Paα (center), and H2 1–0 S(1) 2.122 μm (right) in the velocity ranges −400 km s−1 < v < −200 km s−1 (blue), −200 km s−1 < v < 200 km s−1 (green) and 200 km s−1 < v < 400 km s−1 (red), with respect to the median value between zE* and zW*, zm = 0.0181. The red crosses mark the position of the two nuclei.
Current usage metrics show cumulative count of Article Views (full-text article views including HTML views, PDF and ePub downloads, according to the available data) and Abstracts Views on Vision4Press platform.
Data correspond to usage on the plateform after 2015. The current usage metrics is available 48-96 hours after online publication and is updated daily on week days.
Initial download of the metrics may take a while.