Fig. 5.
Download original image
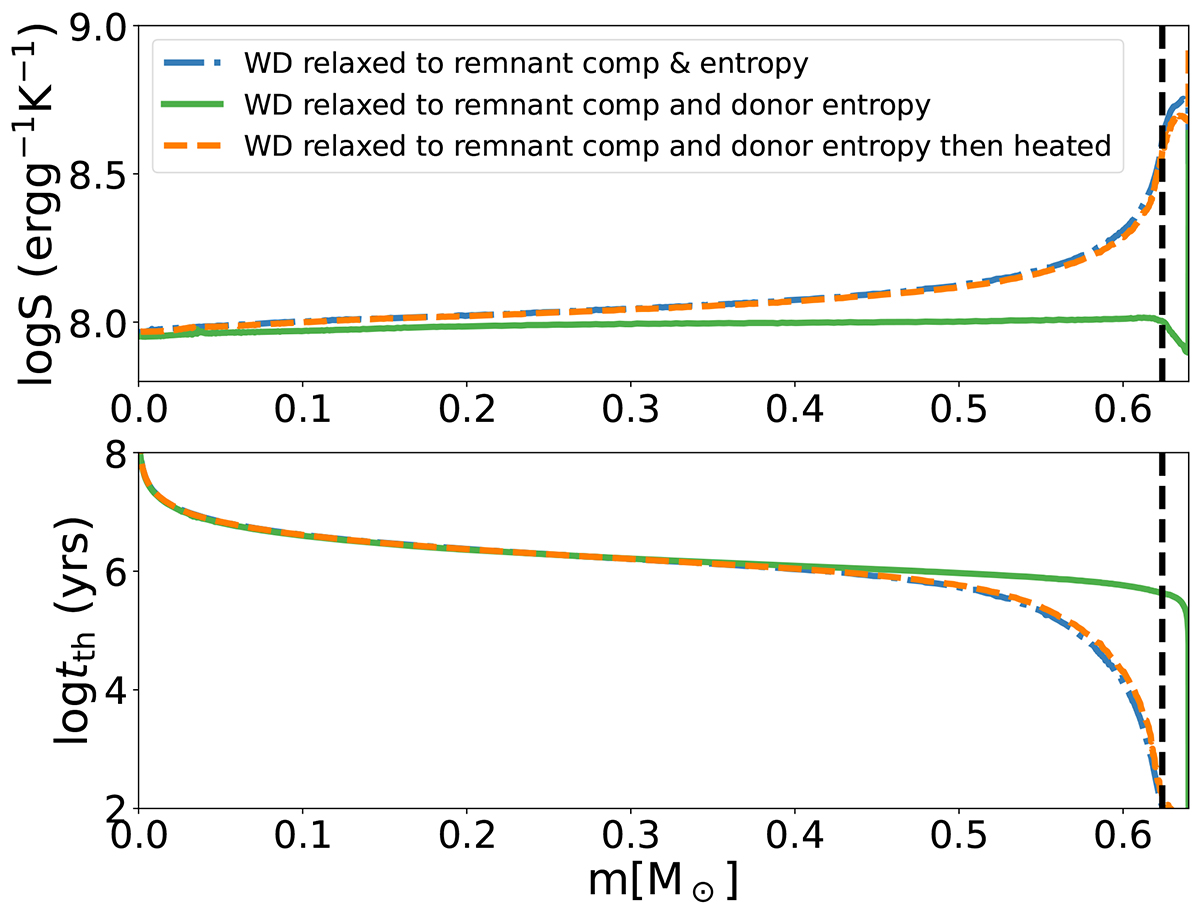
Comparison of heating with relaxation. There are three models here. The blue curve represents the model which has been relaxed to AREPO donor entropy and runaway composition. The orange curve represents the model that has been relaxed to runaway entropy and runaway composition. The green curve represents the blue model, which has been heated. The green and orange overlapping curves show that heating the white dwarf produces the same result as the relaxation. The dashed line marks the layers where the atmosphere is less than 90% C-O dominated, and where an entropy difference is not well defined.
Current usage metrics show cumulative count of Article Views (full-text article views including HTML views, PDF and ePub downloads, according to the available data) and Abstracts Views on Vision4Press platform.
Data correspond to usage on the plateform after 2015. The current usage metrics is available 48-96 hours after online publication and is updated daily on week days.
Initial download of the metrics may take a while.