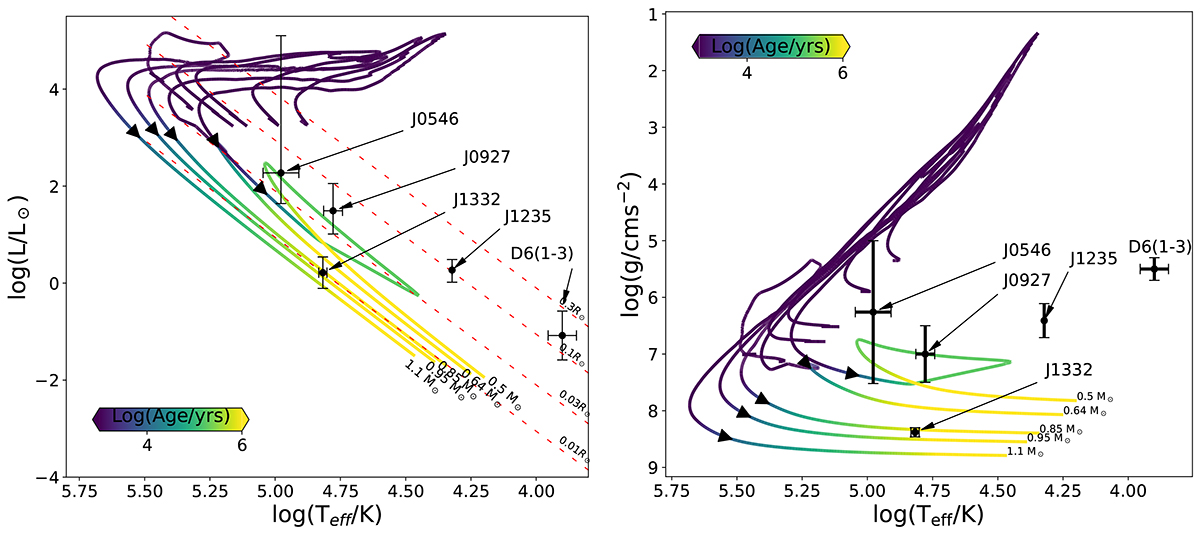
Fig. B.1.
Download original image
Evolutionary tracks for all WD models without any helium removed. [left panel] HR diagram for grid 1 models. All reported D6 stars are plotted as black points. Red lines represent lines of constant radii. The colour bar shows the log(age) of the star. [right panel] Kiel diagram for the same model. The high uncertainty in J3546 comes from combining the minimum and maximum values from Werner et al. (2024) and El-Badry et al. (2023). The big loop of 0.50 M⊙ and the smaller loop of 0.64 M⊙ models is due to unstable helium burning.
Current usage metrics show cumulative count of Article Views (full-text article views including HTML views, PDF and ePub downloads, according to the available data) and Abstracts Views on Vision4Press platform.
Data correspond to usage on the plateform after 2015. The current usage metrics is available 48-96 hours after online publication and is updated daily on week days.
Initial download of the metrics may take a while.