Fig. 8
Download original image
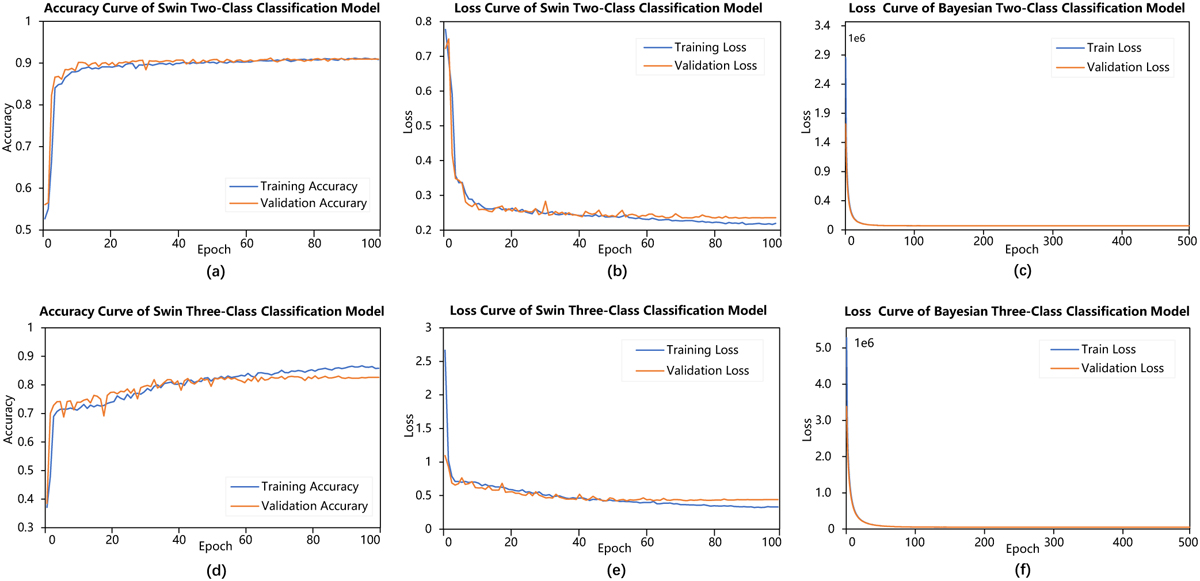
Learning curves of the models. The first row presents the two-class classification model, with (a) and (b) representing the accuracy and loss curves for the Swin Transformer two-class model, respectively, while (c) shows the loss curve of the Bayesian two-class model. The second row displays the three-class classification model, where (d) and (e) represent the accuracy and loss curves for the Swin Transformer three-class model, and (f) shows the loss curve of the Bayesian three-class model.
Current usage metrics show cumulative count of Article Views (full-text article views including HTML views, PDF and ePub downloads, according to the available data) and Abstracts Views on Vision4Press platform.
Data correspond to usage on the plateform after 2015. The current usage metrics is available 48-96 hours after online publication and is updated daily on week days.
Initial download of the metrics may take a while.