Fig. 15
Download original image
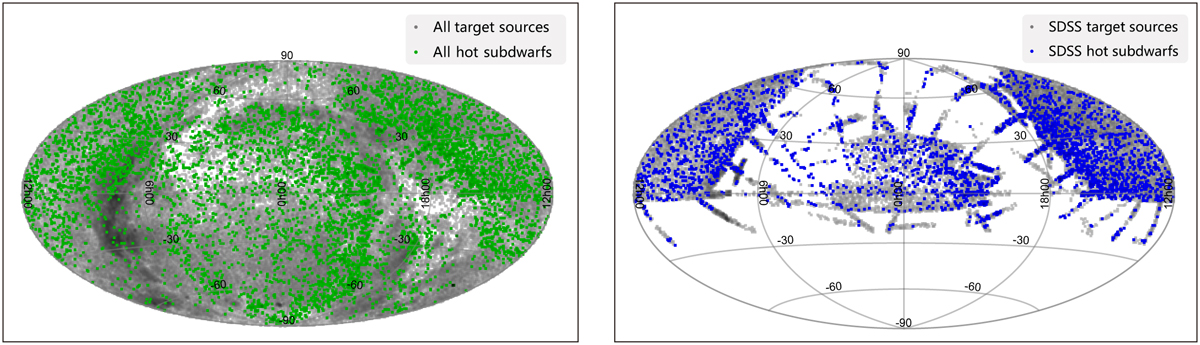
Sky distribution of target sources and hot subdwarfs. The left panel displays the distribution of all target sources (grey dots) selected in Sect. 5.1 along with all hot subdwarfs (green dots) provided by Culpan. The right panel displays the distribution of target sources (grey dots) and hot subdwarfs (blue dots) within the SDSS observation range.
Current usage metrics show cumulative count of Article Views (full-text article views including HTML views, PDF and ePub downloads, according to the available data) and Abstracts Views on Vision4Press platform.
Data correspond to usage on the plateform after 2015. The current usage metrics is available 48-96 hours after online publication and is updated daily on week days.
Initial download of the metrics may take a while.