Fig. 14
Download original image
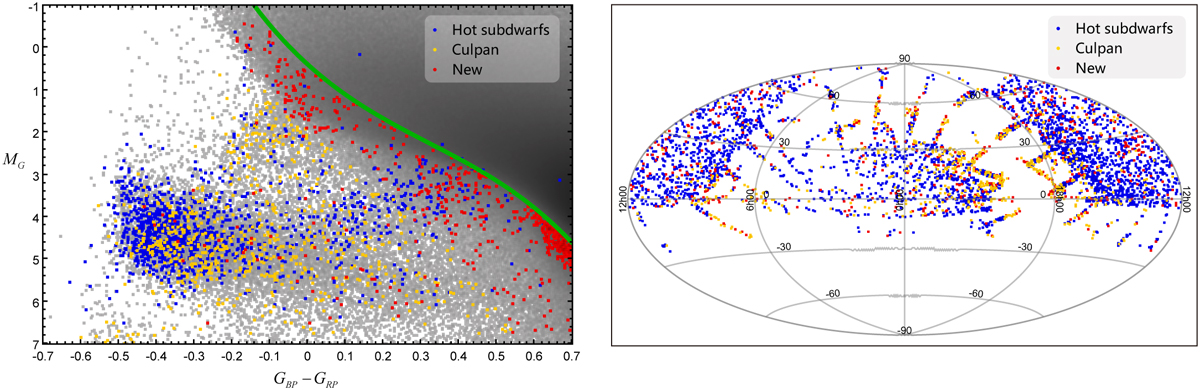
Sample distribution of hot subdwarf candidates in this study. The left panel shows the distribution of samples predicted as hot subdwarfs by the model in the Gaia DR3 HR diagram. Blue points represent known hot subdwarfs, yellow points represent candidates discovered in this study that have already been reported by Culpan, and red points represent newly discovered candidates in this study. Each plotted sample has passed the screening criteria defined in Eq. (18). The right panel displays the sky distribution of all samples.
Current usage metrics show cumulative count of Article Views (full-text article views including HTML views, PDF and ePub downloads, according to the available data) and Abstracts Views on Vision4Press platform.
Data correspond to usage on the plateform after 2015. The current usage metrics is available 48-96 hours after online publication and is updated daily on week days.
Initial download of the metrics may take a while.