Fig. 13.
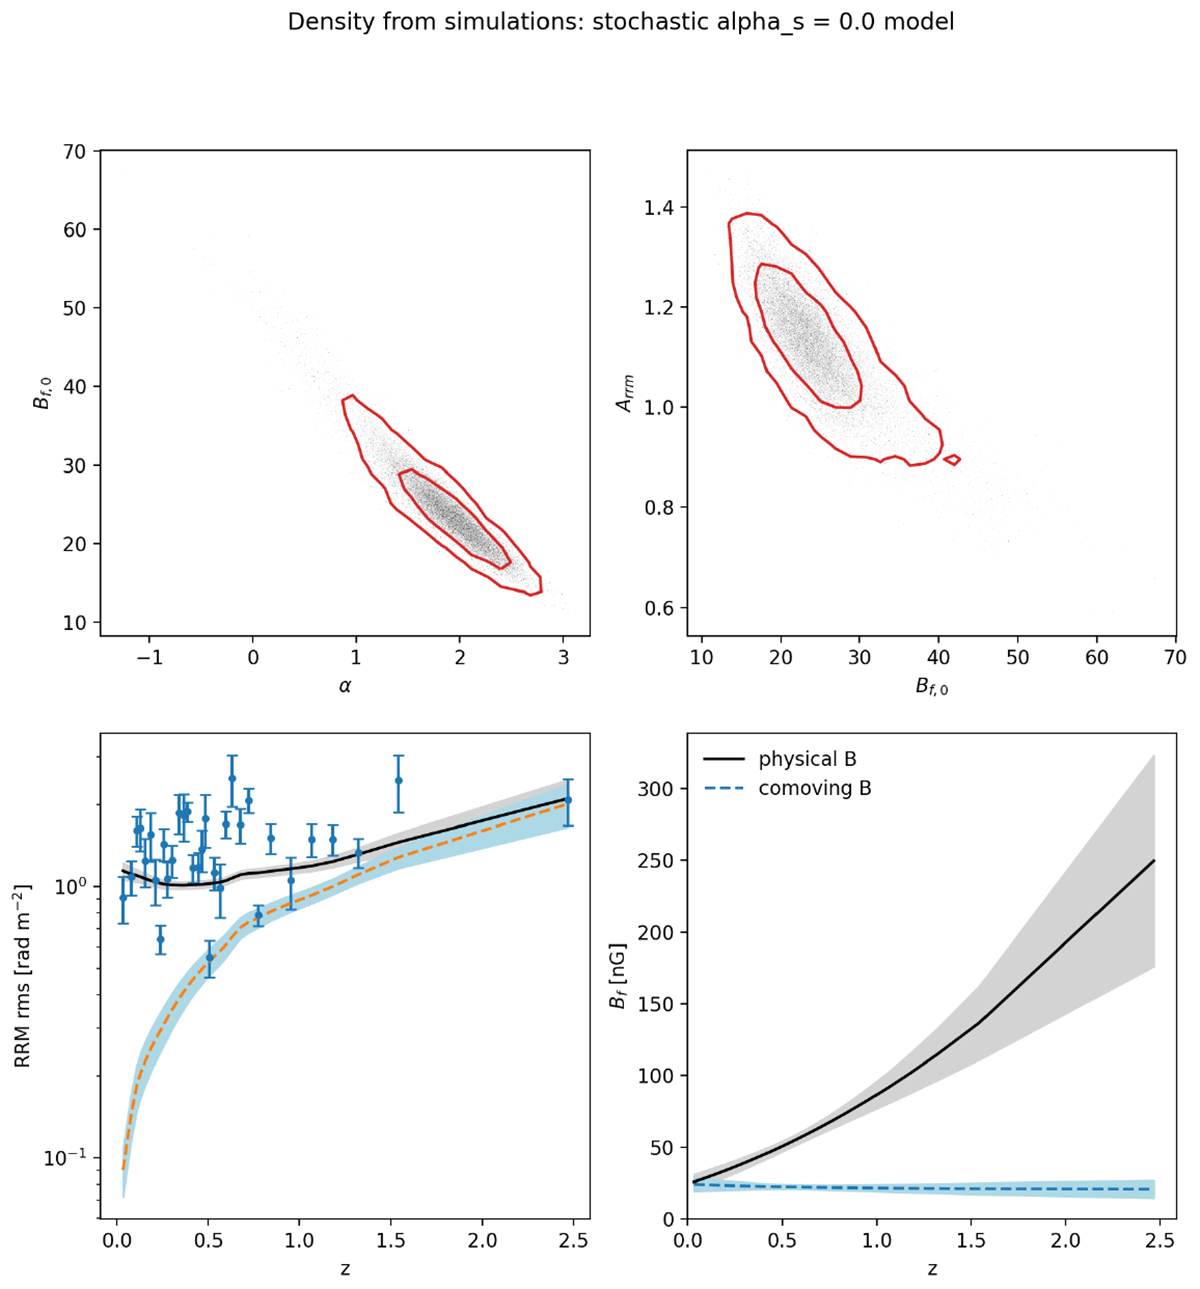
Download original image
Best-fit results of equation (8) to the RRM rms as a function of the redshift computed from the GRM filtered sample. The gas density is taken from the LOS extracted from the MHD simulation of the primordial stochastic model with αs = 0.0. The case with Bf independent of δg is assumed here. Top-left and top-right: 2D distributions (dots), and 1-sigma and 2-sigma confidence level contours (solid lines) of the fit parameters α, Bf, 0, and Arrm. Bottom-left: RRM rms measured in redshift bins (circles) and best-fit curve (solid) and its error range (grey-shaded area). The fit component of the sole filaments is also shown (dashed line) along with its uncertainty (shaded area). Bottom-right: Evolution with redshift z of the best-fit filament physical (solid line) and comoving magnetic field strength (dashed). The error range is also shown (shaded areas).
Current usage metrics show cumulative count of Article Views (full-text article views including HTML views, PDF and ePub downloads, according to the available data) and Abstracts Views on Vision4Press platform.
Data correspond to usage on the plateform after 2015. The current usage metrics is available 48-96 hours after online publication and is updated daily on week days.
Initial download of the metrics may take a while.