Fig. 3
Download original image
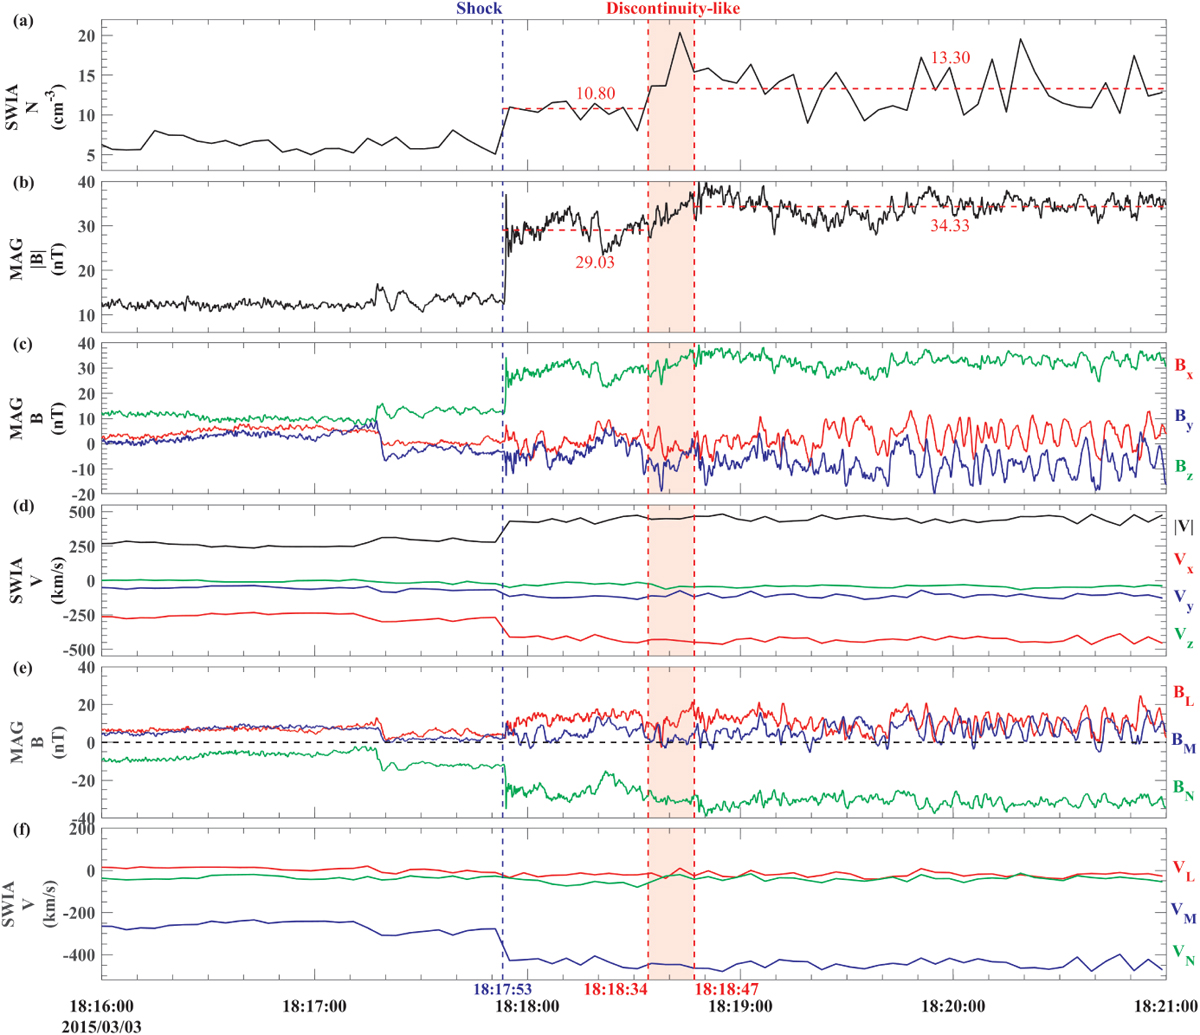
Zoom-in plot of magnetic field and plasma parameters around the discontinuity-like structure. (a) Proton density. (b) Magnetic field magnitude. (c) Magnetic field components in MSO coordinates. (d) Proton velocity components in MSO coordinates and proton bulk speed. (e) Magnetic field components in local LMN coordinates. (f) Proton velocity components in local LMN coordinates. The upstream and downstream averages are shown as horizontal dashed red lines in the panels of ion density and magnetic field strength. The vertical dashed blue line indicates the transmitted IP shock. The shaded region bounded by vertical dashed red lines indicates the discontinuity-like structure interval.
Current usage metrics show cumulative count of Article Views (full-text article views including HTML views, PDF and ePub downloads, according to the available data) and Abstracts Views on Vision4Press platform.
Data correspond to usage on the plateform after 2015. The current usage metrics is available 48-96 hours after online publication and is updated daily on week days.
Initial download of the metrics may take a while.