Fig. 9.

Download original image
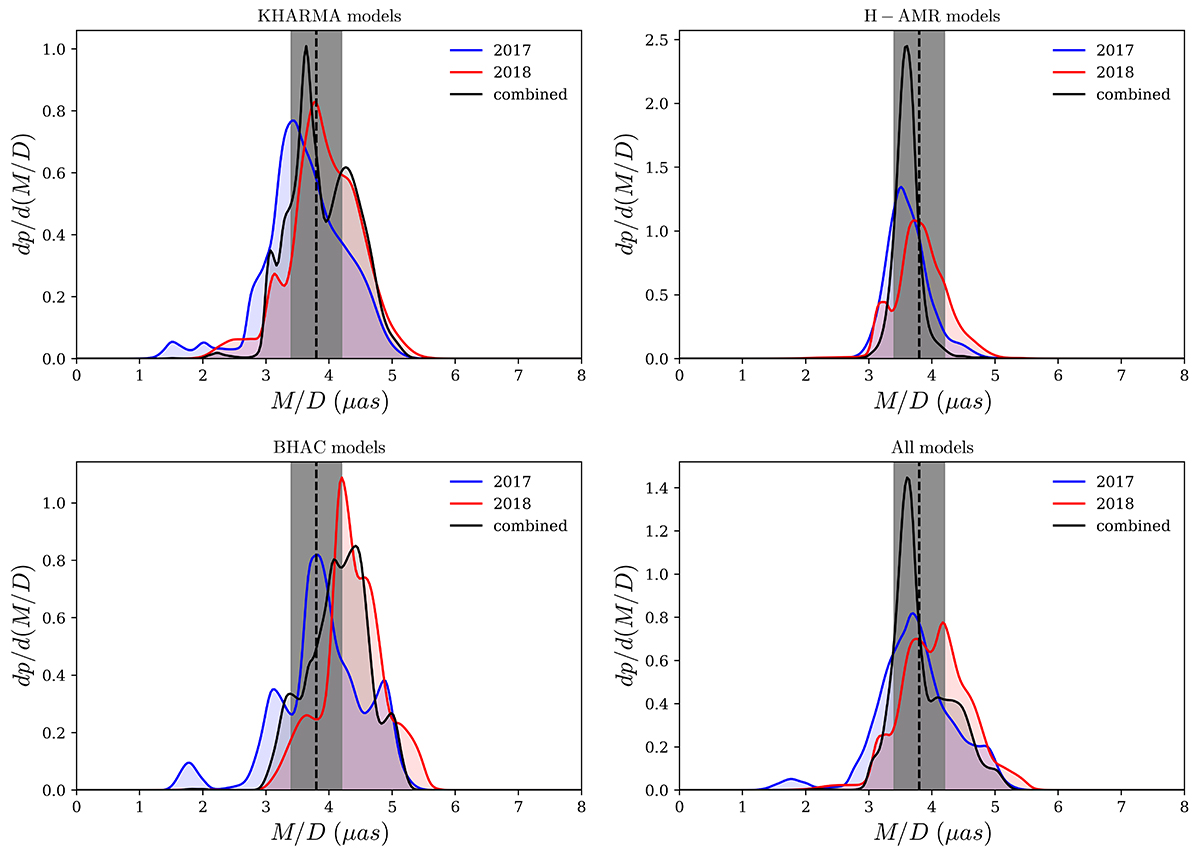
Distribution of M/D obtained by fitting the 2017 (blue) and 2018 (red) data with the fiducial models shown in Table 3. These distributions are generated from the top 10% best-fitting snapshots by χ2. The results for models prepared by the KHARMA, H-AMR, and BHACpipelines are shown separately, together with the result for all the models combined. The distribution when combining both the 2017 and 2018 result by the multi-epoch scoring algorithm is shown as the black profile. The vertical dashed black line and shaded gray region mark the ranges of M/D = 3.8 ± 0.4 μas reported in Event Horizon Telescope Collaboration (2019a).
Current usage metrics show cumulative count of Article Views (full-text article views including HTML views, PDF and ePub downloads, according to the available data) and Abstracts Views on Vision4Press platform.
Data correspond to usage on the plateform after 2015. The current usage metrics is available 48-96 hours after online publication and is updated daily on week days.
Initial download of the metrics may take a while.


