Fig. 8.
Download original image
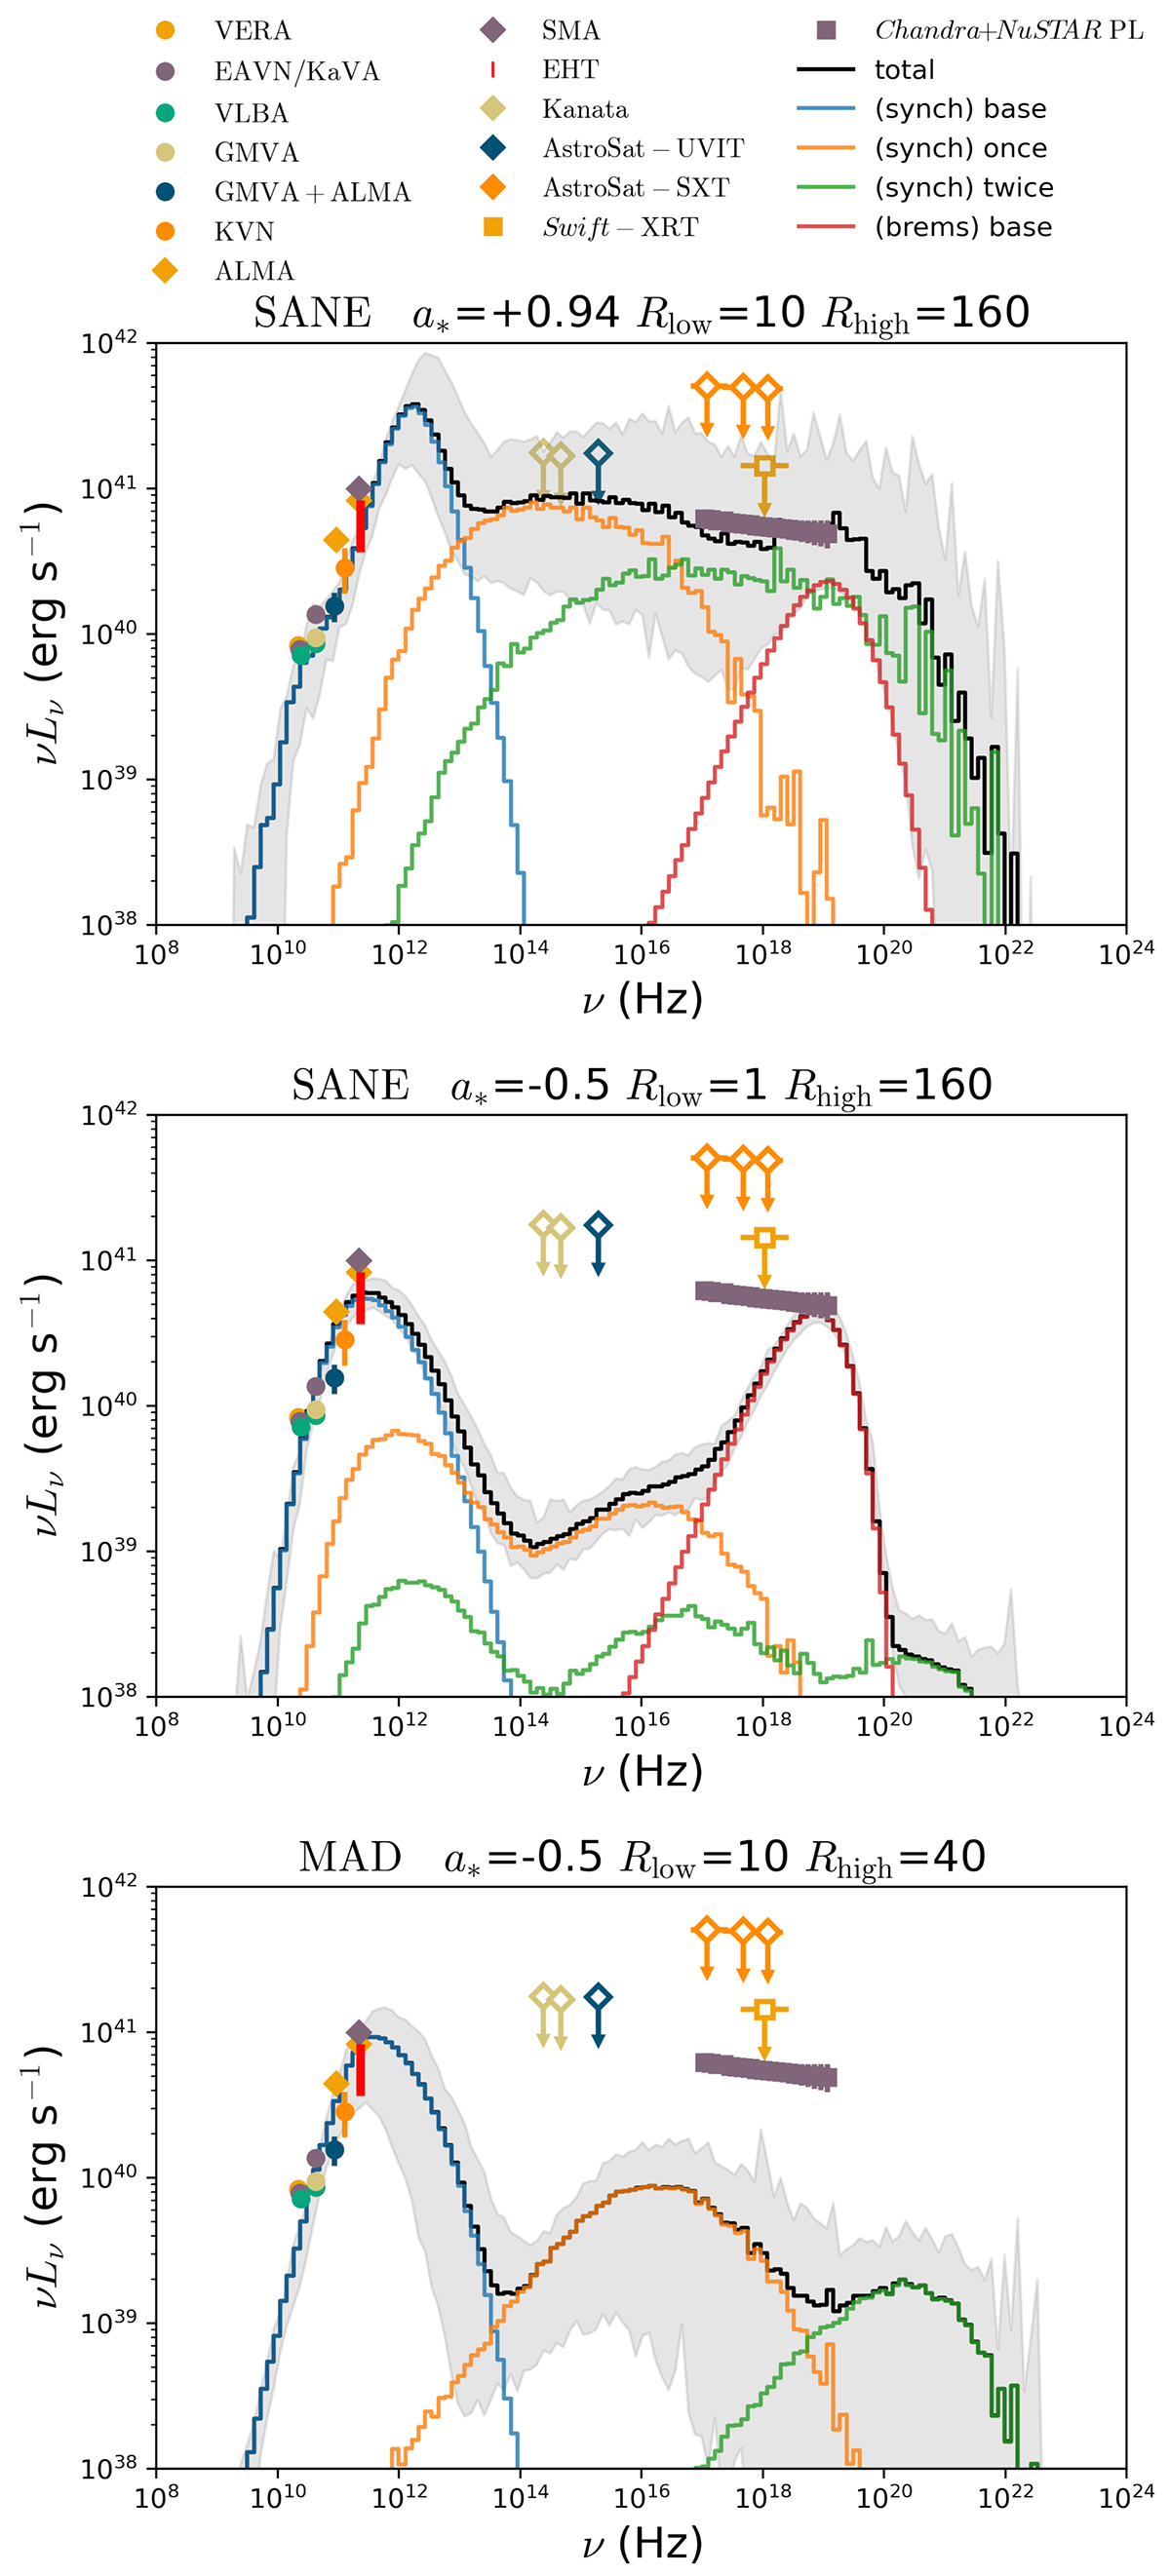
Time-averaged SEDs of selected best-bet models. The data points are taken from the multi-wavelength observations during the 2018 EHT campaign (EHT MWL Science Working Group 2024). The EHT observation is marked by the vertical red bar. The gray region of the SED indicates the variations of the SED for different snapshots. The colored histograms correspond to different radiative processes: synchrotron emission (blue), synchrotron photons scattered once (orange), synchrotron photons scattered twice (green), and bremsstrahlung (red). The total emission is displayed in black.
Current usage metrics show cumulative count of Article Views (full-text article views including HTML views, PDF and ePub downloads, according to the available data) and Abstracts Views on Vision4Press platform.
Data correspond to usage on the plateform after 2015. The current usage metrics is available 48-96 hours after online publication and is updated daily on week days.
Initial download of the metrics may take a while.