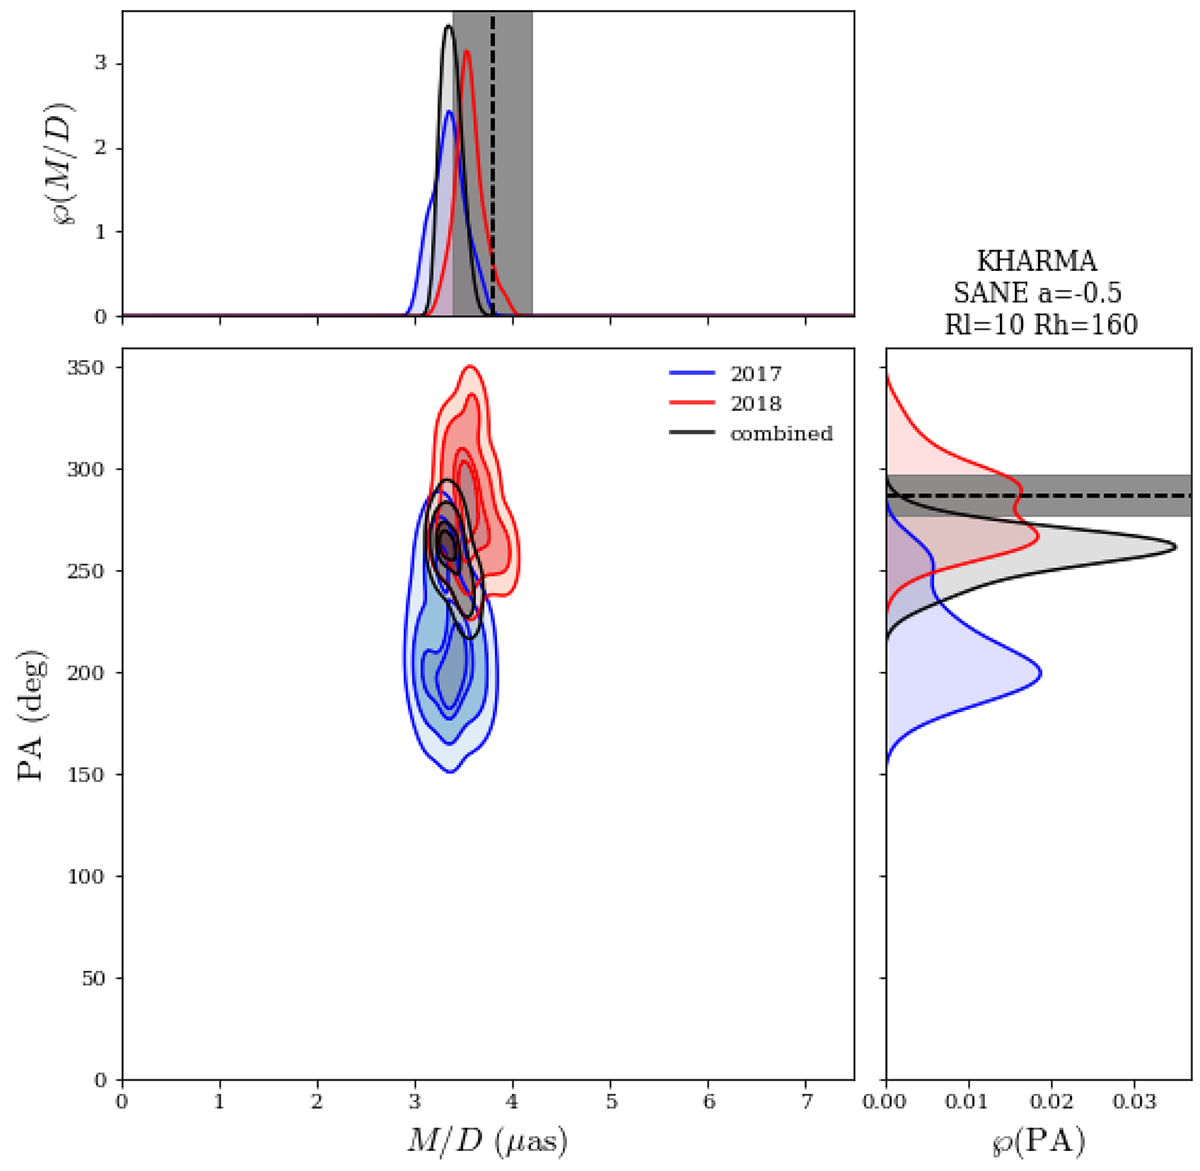
Fig. 6.
Download original image
Demonstration of the multi-epoch scoring based on the KHARMA SANE model with (a*, Rlow, Rhigh)=(−0.5, 10, 160). The 2017 and 2018 snapshot scoring results for the given model are shown in the M/D – PA plane with the blue and red distributions, respectively. The larger the overlap between the red and blue distributions, the better the fit of the multi-epoch observations with a single model. The black profile indicates the normalized combined distribution of the best-fit parameters computed according to the multi-epoch scoring procedure (see Sect. 4.4 for details). The dashed lines and shaded areas are the same as explained in Figs. 4 and 5.
Current usage metrics show cumulative count of Article Views (full-text article views including HTML views, PDF and ePub downloads, according to the available data) and Abstracts Views on Vision4Press platform.
Data correspond to usage on the plateform after 2015. The current usage metrics is available 48-96 hours after online publication and is updated daily on week days.
Initial download of the metrics may take a while.