Open Access
Fig. 4.
Download original image
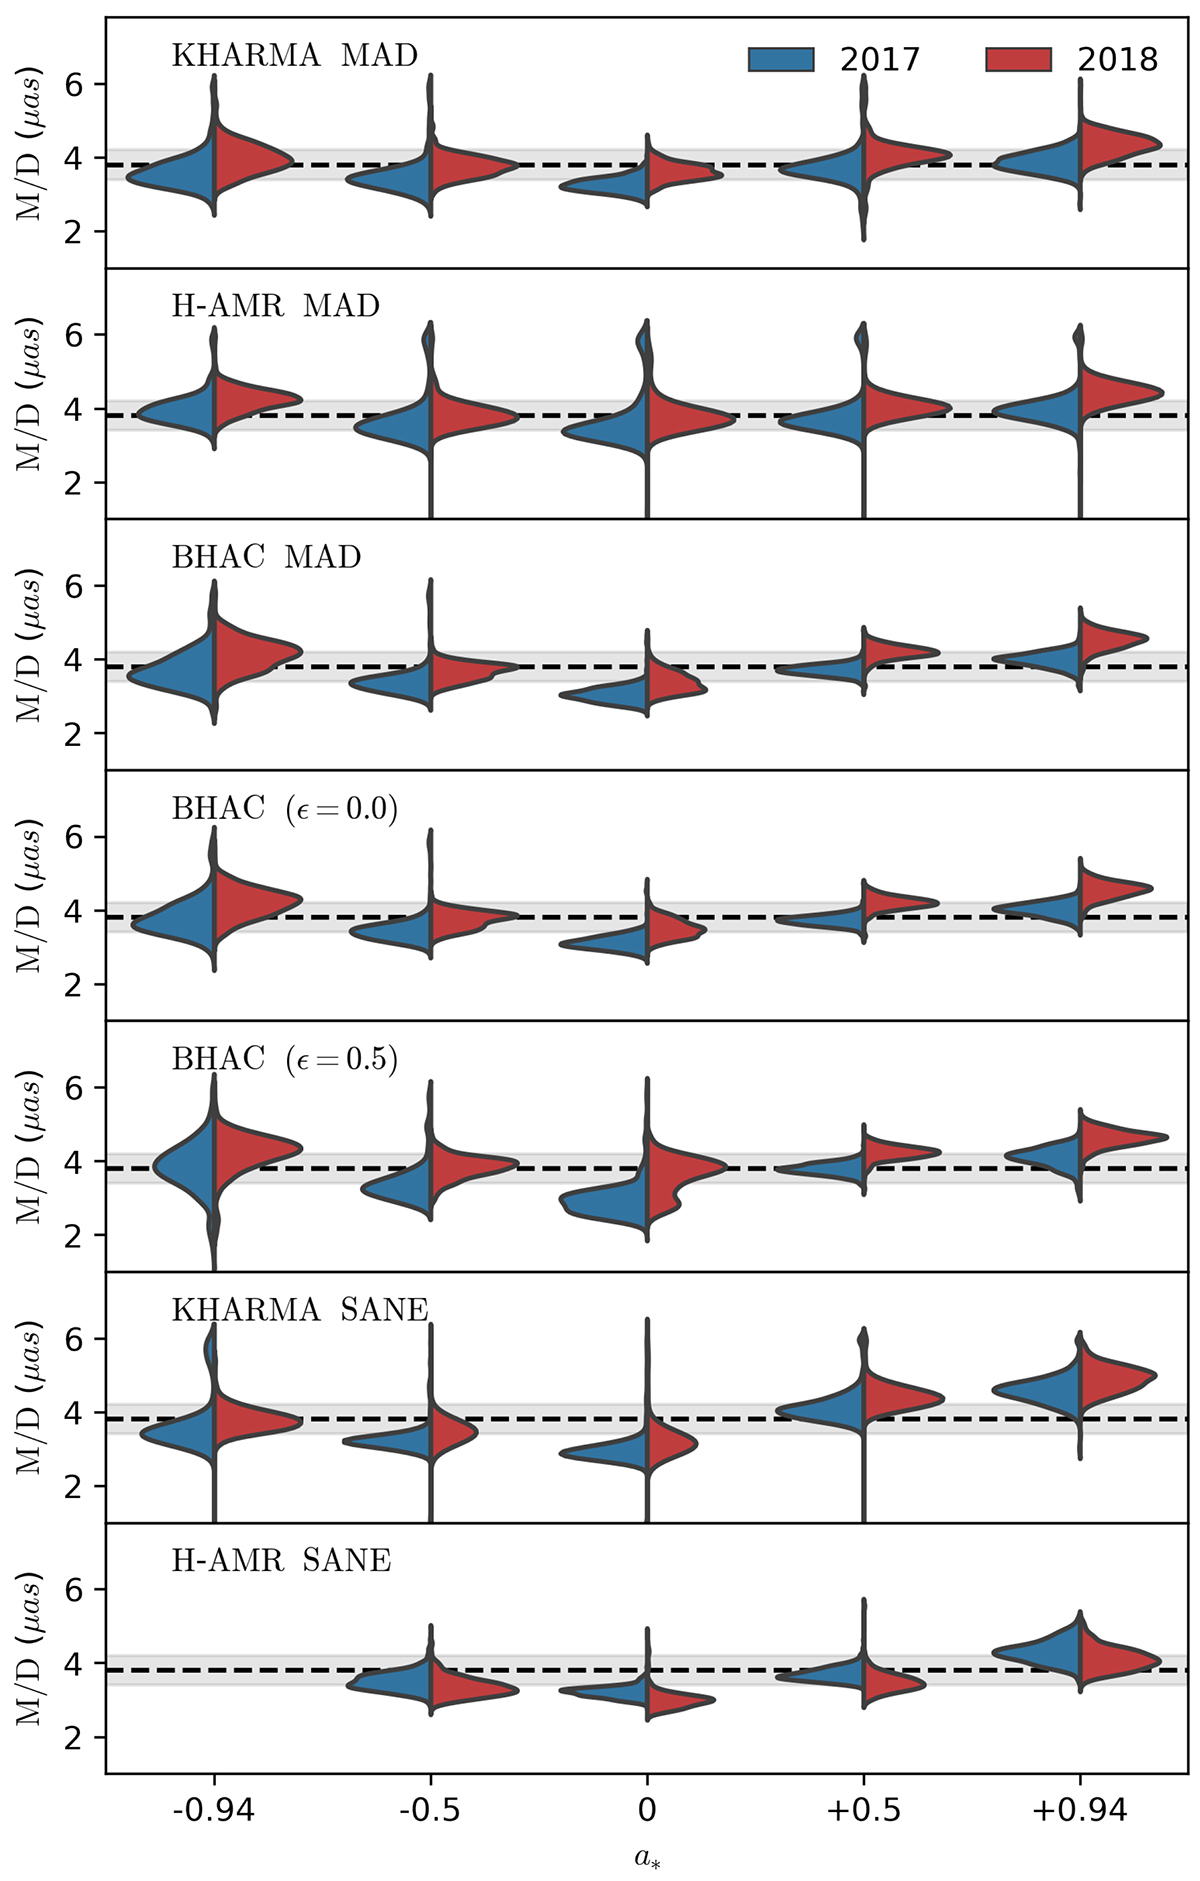
Violin plots for M/D distributions from the snapshot scoring with 2017 and 2018 EHT observations for models with Rlow = 1 and Rhigh = 40 in the image library. The horizontal dashed black line and shaded gray region mark the ranges of M/D = 3.8 ± 0.4 μas reported in M87* 2017 I.
Current usage metrics show cumulative count of Article Views (full-text article views including HTML views, PDF and ePub downloads, according to the available data) and Abstracts Views on Vision4Press platform.
Data correspond to usage on the plateform after 2015. The current usage metrics is available 48-96 hours after online publication and is updated daily on week days.
Initial download of the metrics may take a while.