Open Access
Fig. 5.
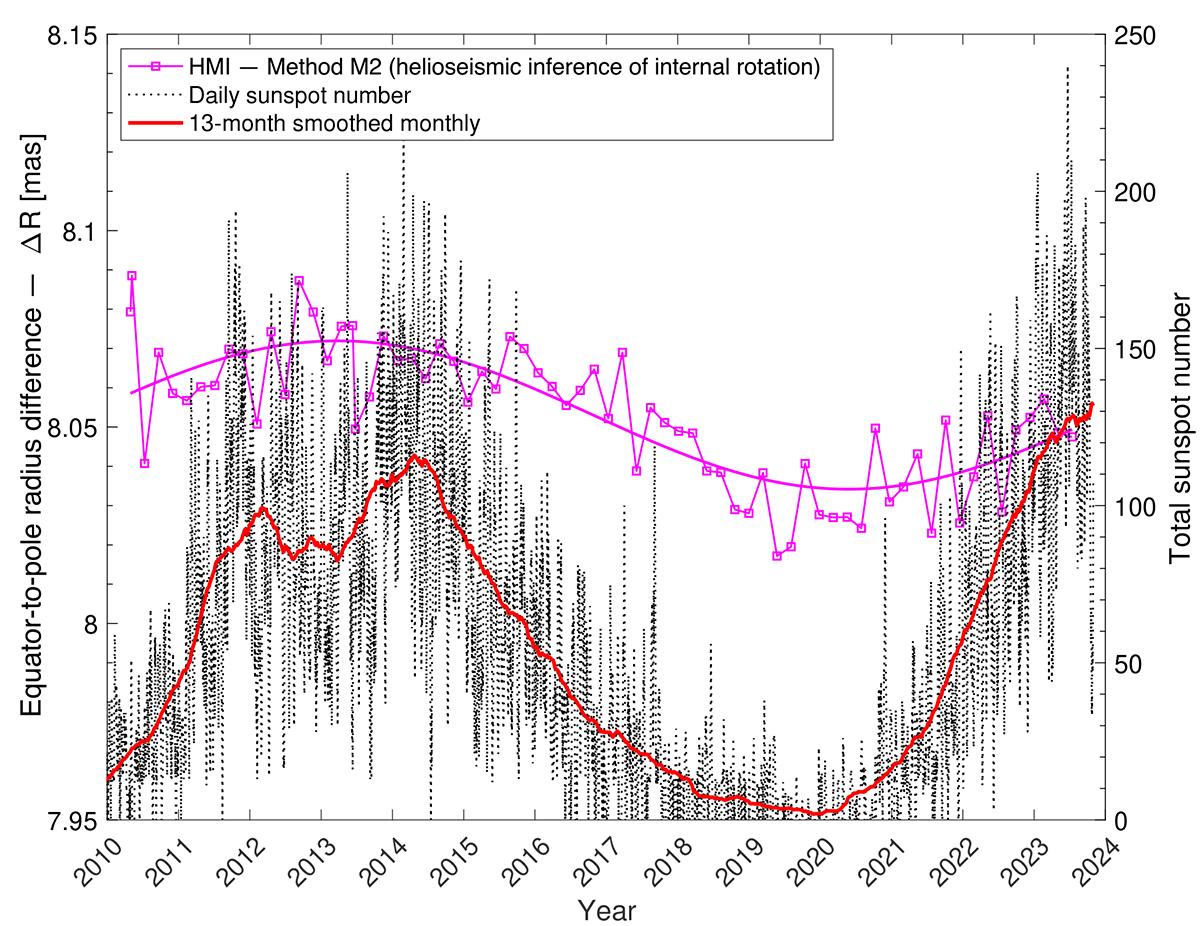
Download original image
ΔR time evolution, as determined through helioseismology (Method M2), which exhibits slight variations during sunspot cycles 24 and 25 (∼0.05 mas), with peak-to-peak values ranging from 8.02 to 8.09 mas.
Current usage metrics show cumulative count of Article Views (full-text article views including HTML views, PDF and ePub downloads, according to the available data) and Abstracts Views on Vision4Press platform.
Data correspond to usage on the plateform after 2015. The current usage metrics is available 48-96 hours after online publication and is updated daily on week days.
Initial download of the metrics may take a while.