Open Access
Fig. 2.
Download original image
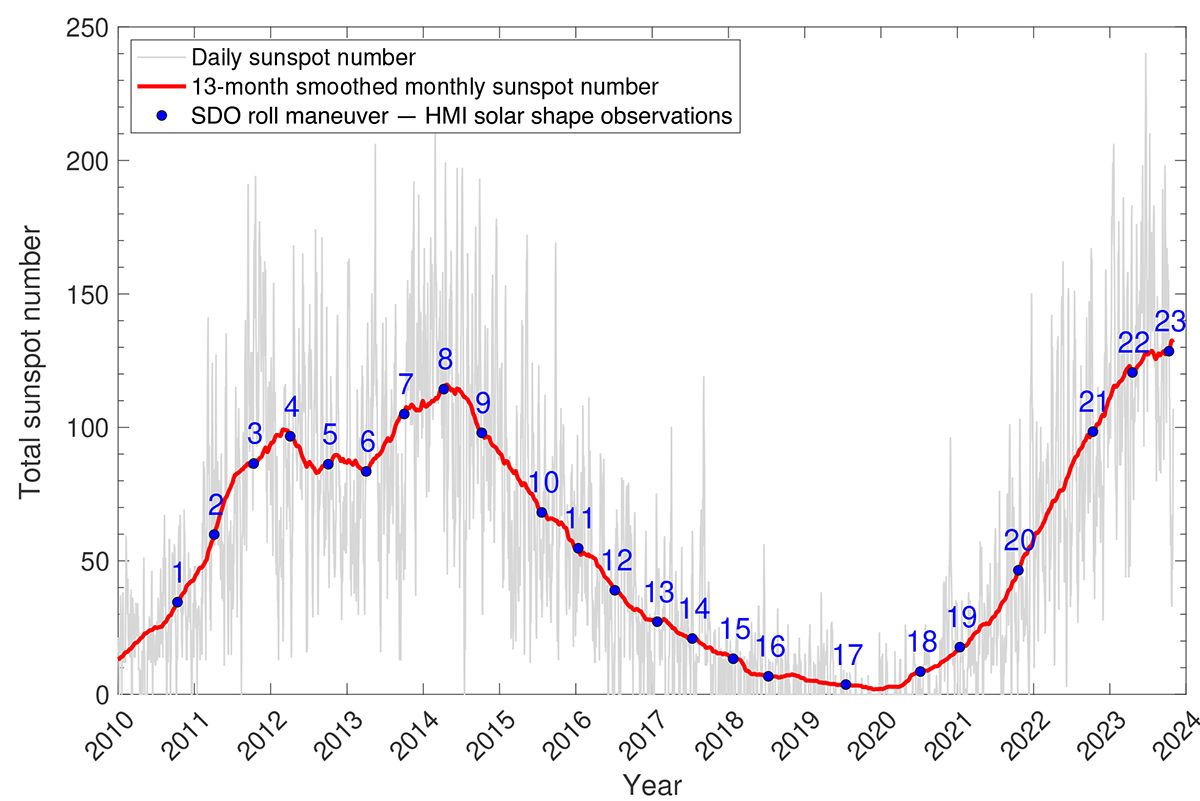
Daily total sunspot number (gray) and 13-month smoothed monthly sunspot number (red) from 2010 to 2024. Each roll sequence used to determine solar oblateness is represented by a blue dot, numbered sequentially from 1 to 23.
Current usage metrics show cumulative count of Article Views (full-text article views including HTML views, PDF and ePub downloads, according to the available data) and Abstracts Views on Vision4Press platform.
Data correspond to usage on the plateform after 2015. The current usage metrics is available 48-96 hours after online publication and is updated daily on week days.
Initial download of the metrics may take a while.