Open Access
Fig. A.1
Download original image
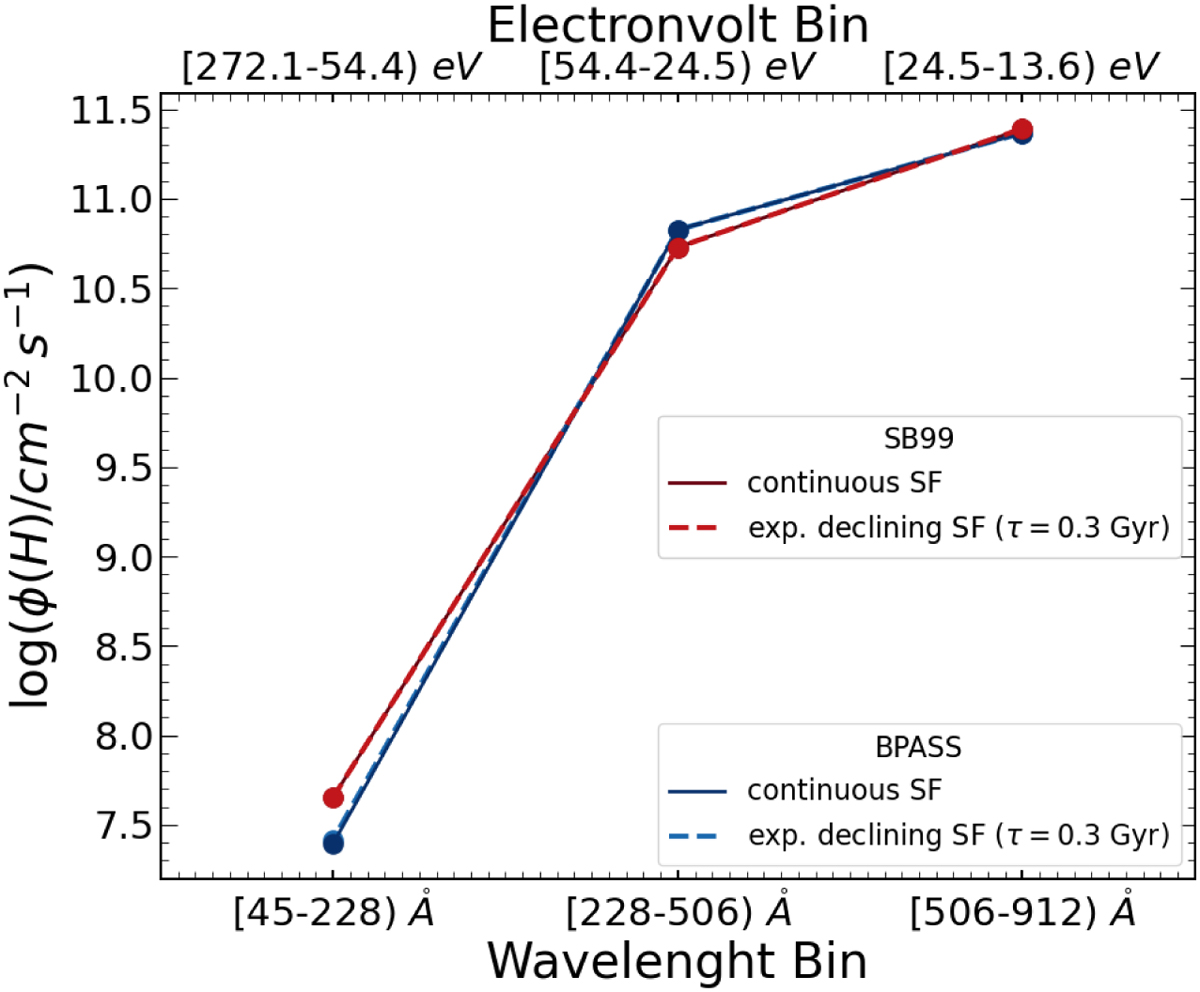
Incident ionising flux, ϕ(H), per energy bin and wavelength bin (CLOUDY models U = −1.00, n = 2, Z = 0.55 Z⊙) for BPASS (blue lines) and SB99 (red lines). The different SFH models are represented with solid (continuous SF) and dashed lines (exponential declining SF τ = 0.3 Gyr).
Current usage metrics show cumulative count of Article Views (full-text article views including HTML views, PDF and ePub downloads, according to the available data) and Abstracts Views on Vision4Press platform.
Data correspond to usage on the plateform after 2015. The current usage metrics is available 48-96 hours after online publication and is updated daily on week days.
Initial download of the metrics may take a while.