Fig. 6
Download original image
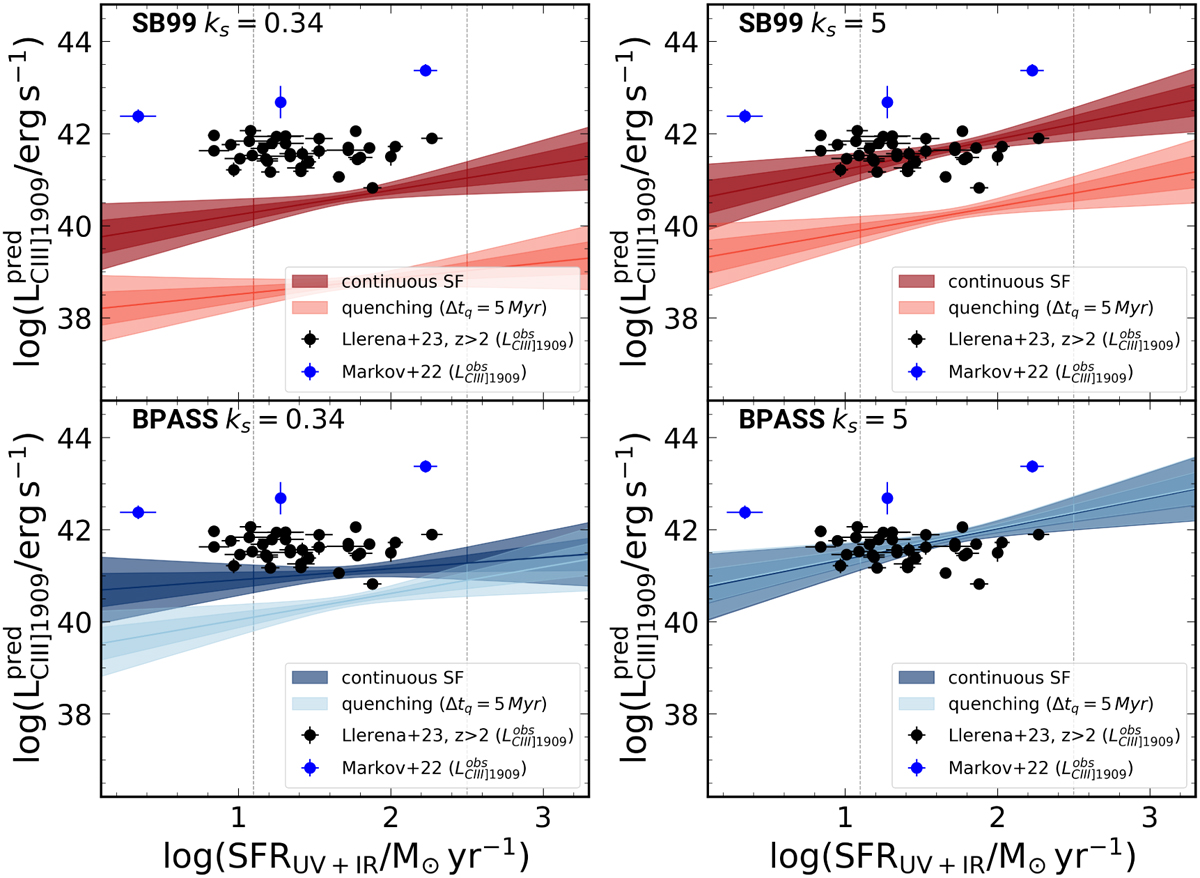
Predicted luminosity of CIII] 1909 Å as a function of the total SFR (SFRUV+IR) for ks = 0.34 (left panel) and ks = 5 (right panel). The colours correspond to 1–2σ dispersion. The central region between the dashed grey lines represents the SFR range of the ALPINE subsample modelled in this work. Red and blue represent the two SFHs considered in this work: continuous and Δtq = 5 Myr. The black points are the observed data from Llerena et al. (2023), the blue points from Markov et al. (2022).
Current usage metrics show cumulative count of Article Views (full-text article views including HTML views, PDF and ePub downloads, according to the available data) and Abstracts Views on Vision4Press platform.
Data correspond to usage on the plateform after 2015. The current usage metrics is available 48-96 hours after online publication and is updated daily on week days.
Initial download of the metrics may take a while.