Fig. 3
Download original image
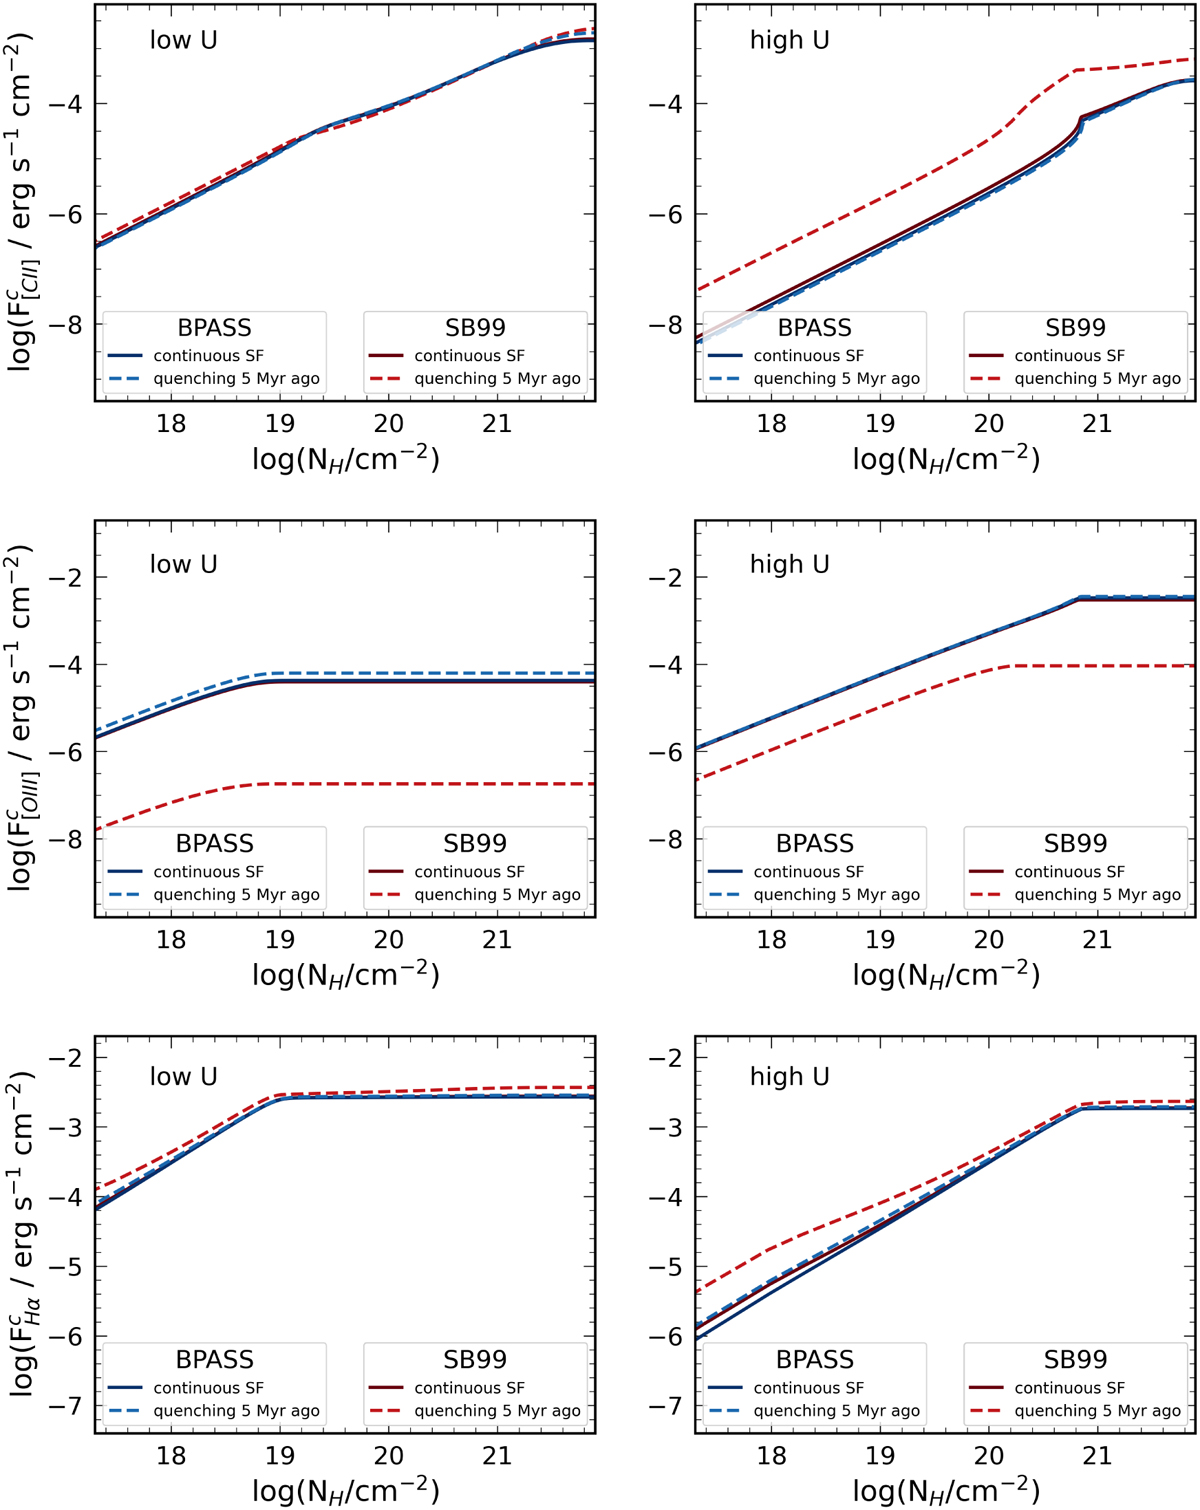
Cumulative flux of [CII] 158 µm (upper panels), [OIII]5007 Å (middle panels), and Hα (lower panels) as a function of the hydrogen column density (NH). We show CLOUDY models log U = −4.00, log n = 3.00, Z = 0.5 5 Z⊙ (left panel; low U) and log U = −2.00, log n = 1.00, Z = 0.55 Z⊙ (right panel; high U). The different SFHs are represented with solid (continuous SF) and dashed lines (quenching Δtq = 5 Myr). Red lines are associated with SB99 models, blue with BPASS models.
Current usage metrics show cumulative count of Article Views (full-text article views including HTML views, PDF and ePub downloads, according to the available data) and Abstracts Views on Vision4Press platform.
Data correspond to usage on the plateform after 2015. The current usage metrics is available 48-96 hours after online publication and is updated daily on week days.
Initial download of the metrics may take a while.