Fig. 8.
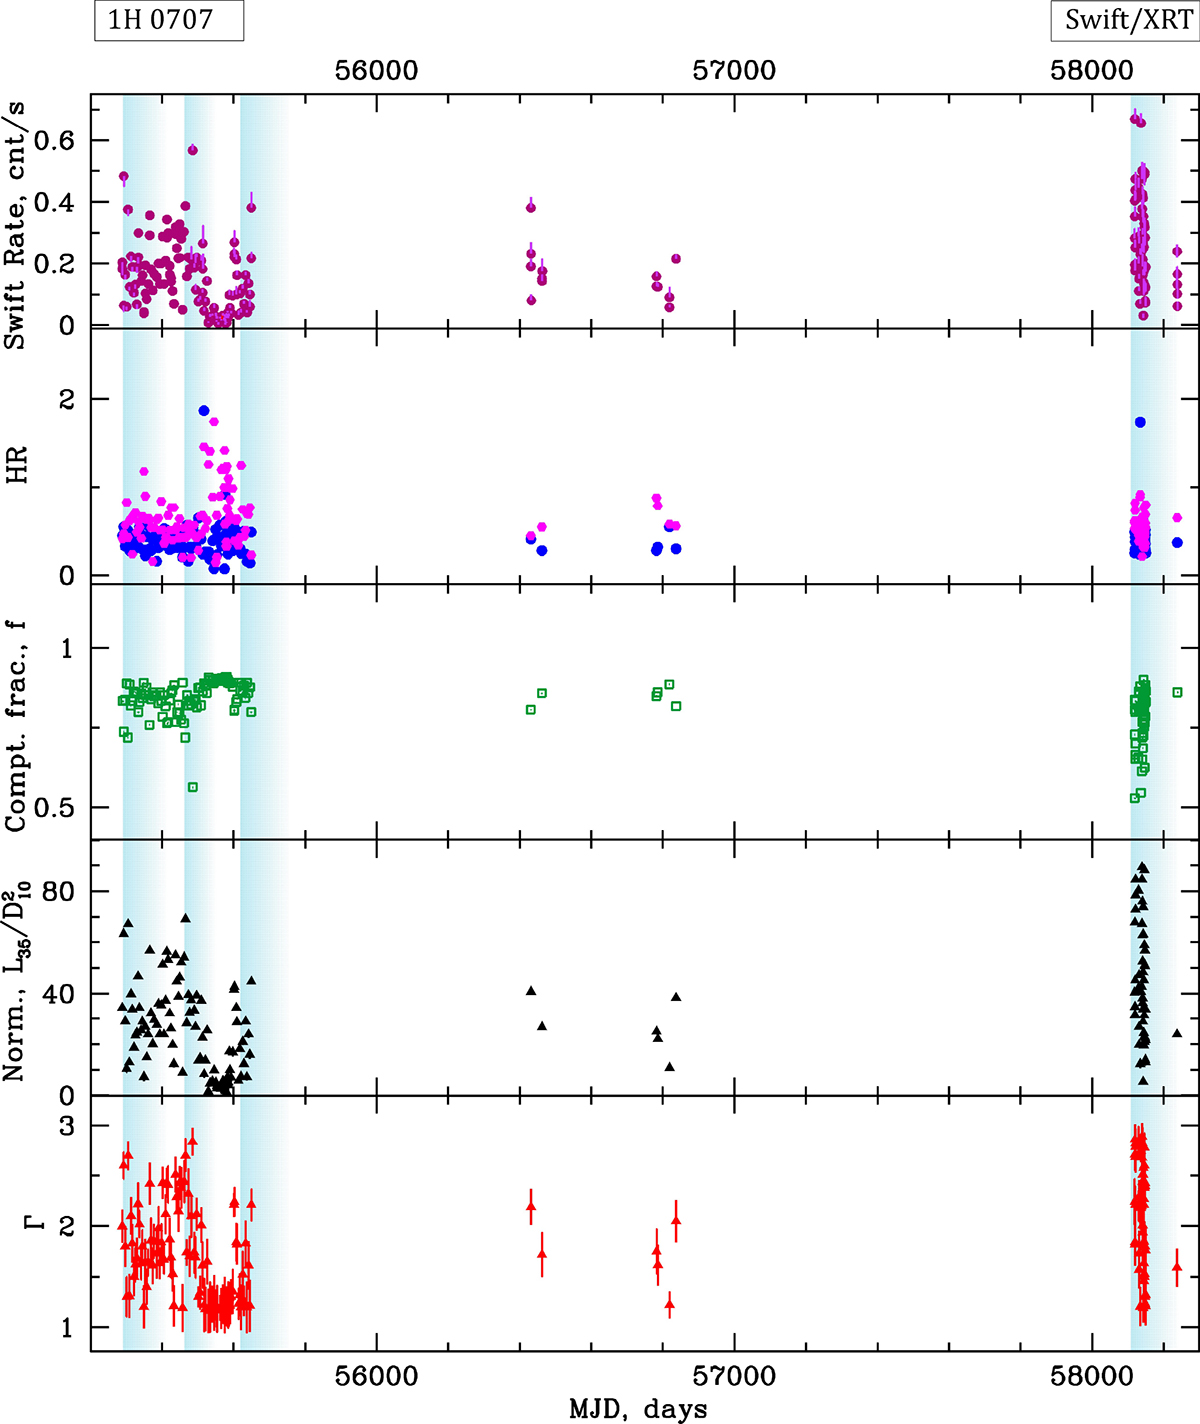
Download original image
Evolution of the Swift/XRT count rate, hardness ratios HR1 and HR2 shown as blue and crimson points, respectively, along with the Comptonized fractionm f, and BMC normalization during 2010–2018 flare of 1H 0707 (from top to bottom). In the very bottom panel, we present an evolution of the photon index Γ = α + 1. The decay phases of the flares are marked with blue vertical strips.
Current usage metrics show cumulative count of Article Views (full-text article views including HTML views, PDF and ePub downloads, according to the available data) and Abstracts Views on Vision4Press platform.
Data correspond to usage on the plateform after 2015. The current usage metrics is available 48-96 hours after online publication and is updated daily on week days.
Initial download of the metrics may take a while.