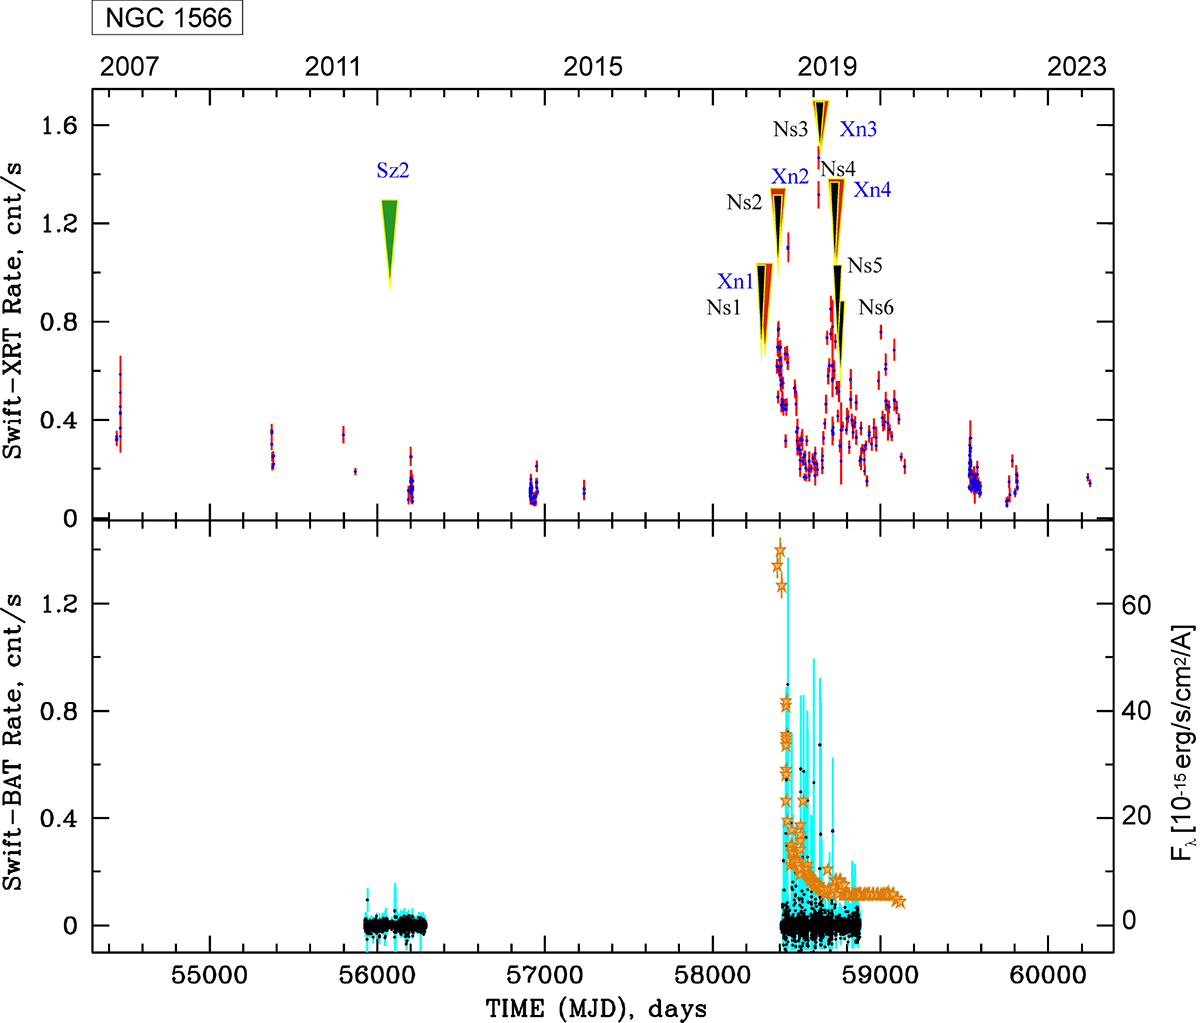
Fig. 2.
Download original image
Evolution of NGC 1566 during 2007–2023 observations with Swift/XRT (top panel, 0.3–10 keV), Swift/BAT (bottom panel, black points, 15–150 keV), and Swift/UVOT (bottom panel, orange stars, UVW2 band [1600–2300 Å], right axis). The green, black, and red triangles indicate the Suzaku, NuSTAR, and XMM-Newton observations, respectively, used in our analysis.
Current usage metrics show cumulative count of Article Views (full-text article views including HTML views, PDF and ePub downloads, according to the available data) and Abstracts Views on Vision4Press platform.
Data correspond to usage on the plateform after 2015. The current usage metrics is available 48-96 hours after online publication and is updated daily on week days.
Initial download of the metrics may take a while.