Fig. 15.
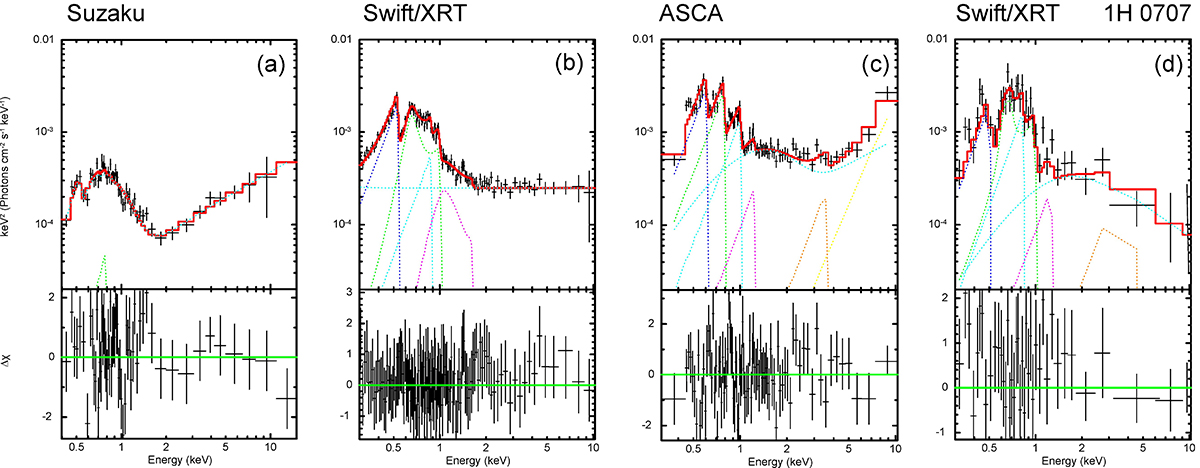
Download original image
Best-fit spectrum of 1H 0707–495 in E * F(E) units during: (a) LHS using Suzaku observation 00091623; (b) (IS) using Swift observation 00091623002; (c) IS using ASCA observation 73043000; and (d) HSS using Swift observation 00080720048. The data are presented by crosses and the best-fit spectral model tbabs*(BMC+N*Laor) by red line. The Comptonization hump component is shown by the dotted sea-green line. To model the Laor line components, we used the N XVII (blue), O III (green), Fe XVII (bright blue), Ne X (pink), S XVI (orange), Fe I–XXII, and Fe XXV/Fe XXVI Kα (yellow) lines with energies of 0.5, 0.65, 0.85, 1.02, 2.9, 6.4, and 6.8 keV, respectively. Bottom: Δχ vs photon energy in keV.
Current usage metrics show cumulative count of Article Views (full-text article views including HTML views, PDF and ePub downloads, according to the available data) and Abstracts Views on Vision4Press platform.
Data correspond to usage on the plateform after 2015. The current usage metrics is available 48-96 hours after online publication and is updated daily on week days.
Initial download of the metrics may take a while.