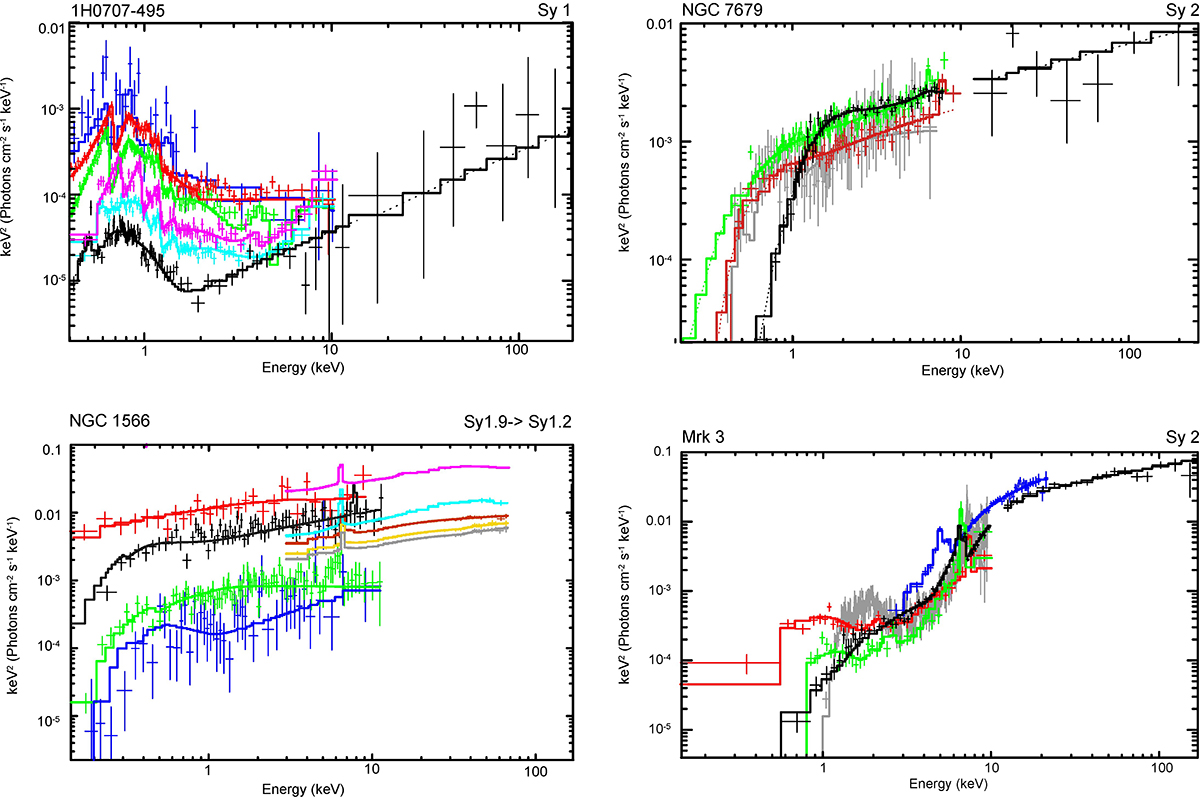
Fig. 14.
Download original image
Representative E * F(E) spectral diagrams that are related to different spectral states for 1H 0707–495 (top left) using Suzaku observation 00091623 (black, LHS) combined with RXTE/HEXTE observation 20309010100 (black, LHS), ASCA observations 73043000 (bright blue, IS), 73043000 (pink, IS), 763100 (green, IS), Swift observation 0090393 (red, IS) and Swift obs 0091623 (blue, HSS); NGC 1566 (bottom left) using Swift observations 0001496 (blue, LHS), 00014923 (green, LHS), 00031742 (black, IS), 00035880 (red, IS), and NuSTAR observations 80301601002 (pink, IS), 80401601002 (bright blue, IS), 80502606002 (brown, IS), 60501031004 (yellow, IS) and 60501031006 (#bbb7ba;, IS); NGC 7679 (top right) using 40631001 (black, LHS, from BeppoSAX), 00088108002 (#bbb7ba;, LHS, from Swift), 66019010 (red, HIMS, from ASCA), and 66019000 (green, IS, from ASCA) and Mrk 3 (bottom-right) using ASCA observation 70002000 (LHS, red), 70002000 (LHS, red), Suzaku observation 709022010 (LHS, green), RXTE observation 20330-01-09-00 (blue, IS), and BeppoSAX observation 50132002 (IS, black).
Current usage metrics show cumulative count of Article Views (full-text article views including HTML views, PDF and ePub downloads, according to the available data) and Abstracts Views on Vision4Press platform.
Data correspond to usage on the plateform after 2015. The current usage metrics is available 48-96 hours after online publication and is updated daily on week days.
Initial download of the metrics may take a while.