Fig. 6
Download original image
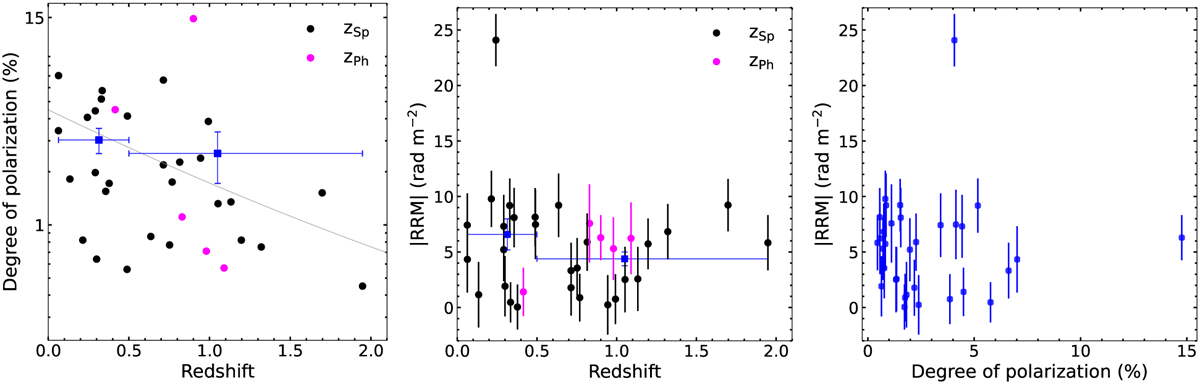
Variations of degrees of polarization, RRM and redshift values. Left and middle panels: degree of polarization and |RRM| as a function of redshift. The sample was split to have a roughly equal number of sources in each redshift bin. Data points from sources with spectroscopic or photometric redshifts are indicated in different colors, as indicated in the legend. The horizontal bars indicate the sizes of the redshift bins, and the vertical bars show the standard errors of the values in the vertical axis. For each plot, the blue squares represent the means of the values in each bin. In the left panel, the gray line is the fit from Carretti et al. (2022) to corresponding data from the LoTSS-DR2 RM grid catalog. Right panel: |RRM| vs. degree of polarization.
Current usage metrics show cumulative count of Article Views (full-text article views including HTML views, PDF and ePub downloads, according to the available data) and Abstracts Views on Vision4Press platform.
Data correspond to usage on the plateform after 2015. The current usage metrics is available 48-96 hours after online publication and is updated daily on week days.
Initial download of the metrics may take a while.