Fig. 3
Download original image
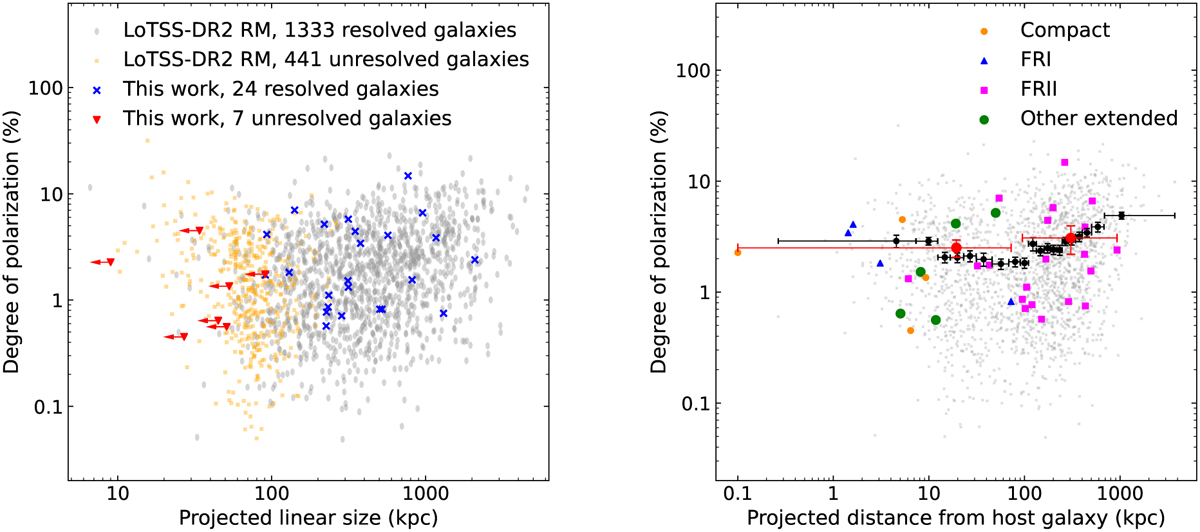
Comparison of the variations of the degrees of polarization with linear size and with projected distance from the host in the ELAIS-N1 sample (this work) and in the LoTSS-DR2 RM sample. Left panel: degree of polarization of the polarized component as a function of the projected linear source size for the radio galaxies in the LoTSS-DR2 RM sample and for those of our ELAIS-N1 sample, with upper limits on the linear source sizes for unresolved radio galaxies (shown in orange for the LoTSS-DR2 RM sample and in red with horizontal arrows for the ELAIS-N1 sample). Right panel: degree of polarization of the polarized component as a function of the projected distance from the center of the host galaxy to the polarized component. The gray dots show the LoTSS-DR2 RM sample, and the other symbols represent different classes of radio galaxies in ELAIS-N1 in which polarization was detected. The black dots show the mean values in bins of 100 values for LoTSS-DR2-RM, and the red dots are the values for ELAIS-N1, where two bins of approximately equal numbers of polarized components were used. The horizontal lines show the width of each bin, and the vertical lines show the standard errors on the mean values.
Current usage metrics show cumulative count of Article Views (full-text article views including HTML views, PDF and ePub downloads, according to the available data) and Abstracts Views on Vision4Press platform.
Data correspond to usage on the plateform after 2015. The current usage metrics is available 48-96 hours after online publication and is updated daily on week days.
Initial download of the metrics may take a while.