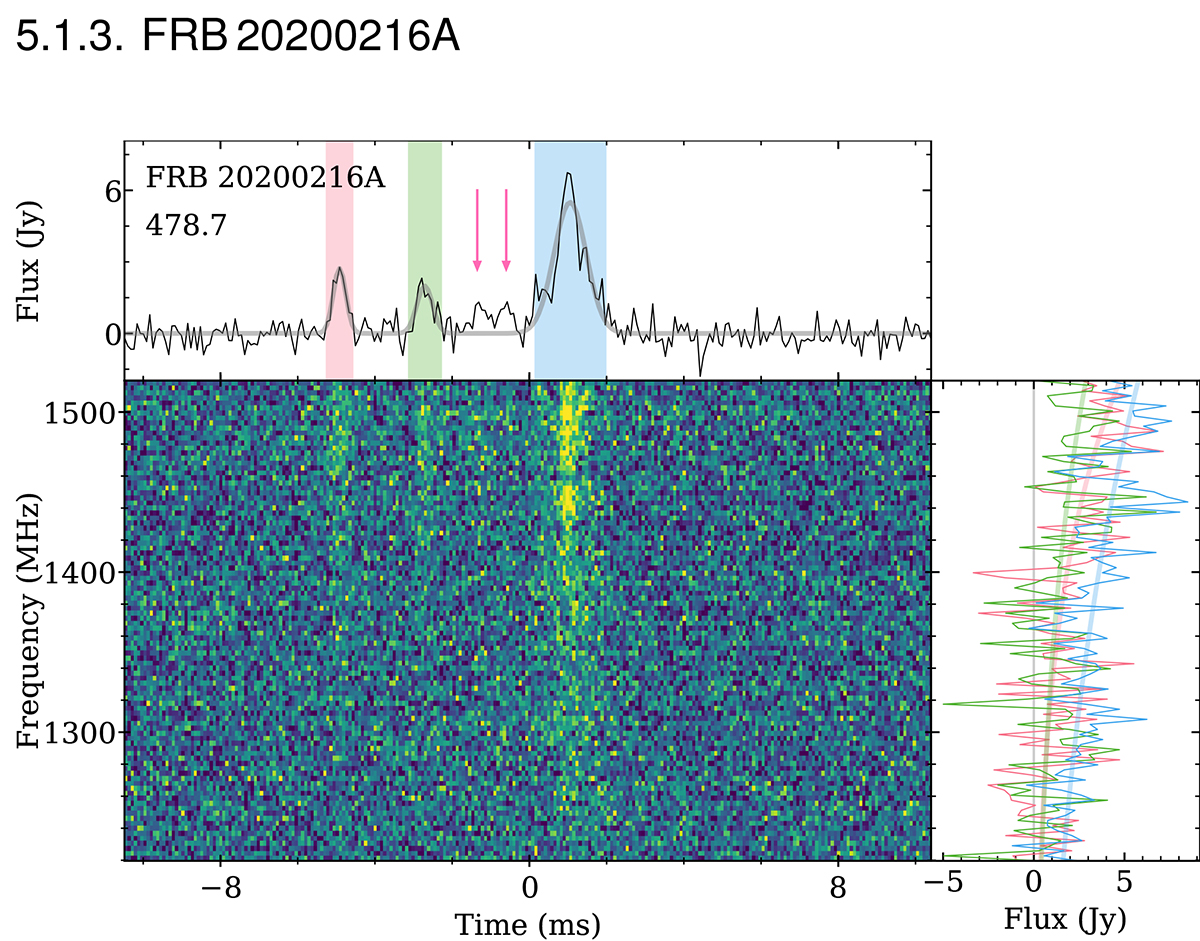
Fig. 7.
Download original image
Dynamic spectrum of FRB 20200216A. In the pulse profile (top panel), each coloured region shows a distinct component and fitted to a Gaussian. Their respective spectra are shown in the bottom right panel in the same colour, and fitted to a power-law (transparent solid lines). The two pink arrows on the pulse profile indicate the position of the two potential subcomponents between the precursors and the main component.
Current usage metrics show cumulative count of Article Views (full-text article views including HTML views, PDF and ePub downloads, according to the available data) and Abstracts Views on Vision4Press platform.
Data correspond to usage on the plateform after 2015. The current usage metrics is available 48-96 hours after online publication and is updated daily on week days.
Initial download of the metrics may take a while.