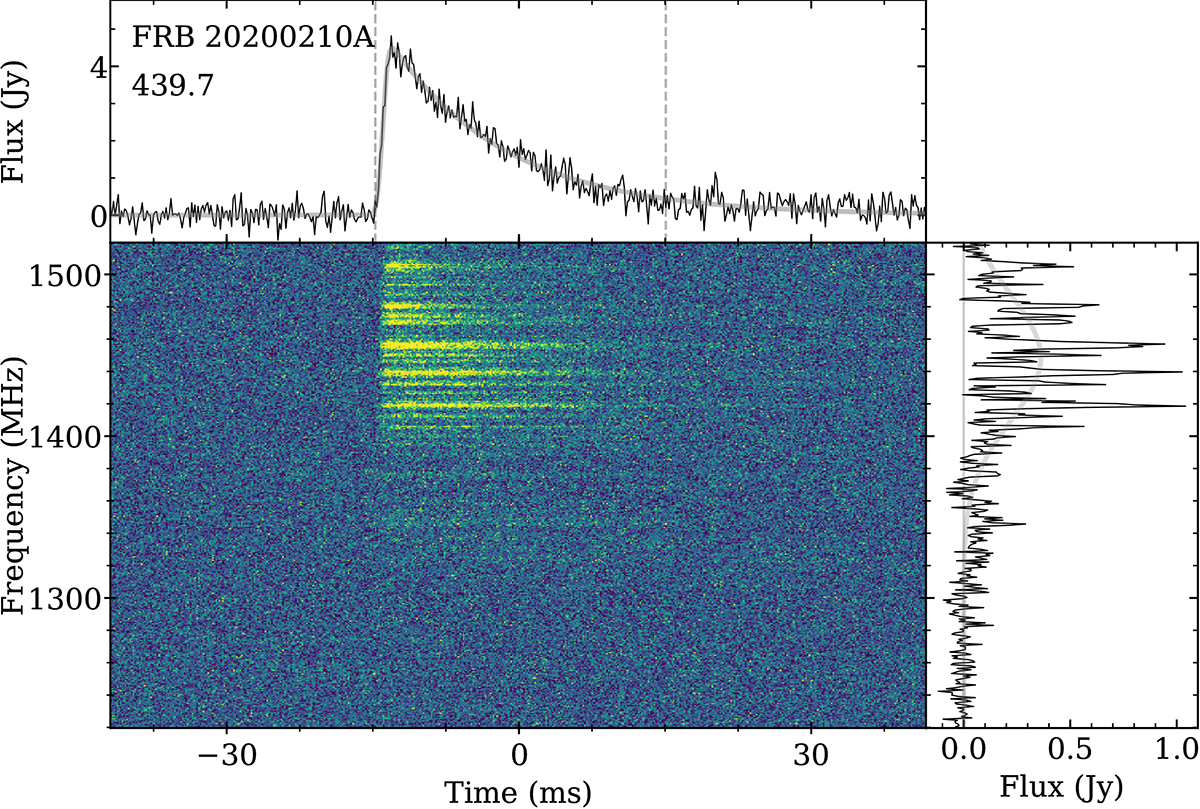
Fig. 4.
Download original image
Dynamic spectrum of FRB 20200210A. We re-use the conventions of Fig. 3, but the fit lines are now grey. The vertical, dashed lines in the top panel indicate the burst section from which the spectrum is extracted. This spectrum and its Gaussian fit are shown in the bottom right. We ascribe the large intensity fluctuations to scintillation in the Milky Way.
Current usage metrics show cumulative count of Article Views (full-text article views including HTML views, PDF and ePub downloads, according to the available data) and Abstracts Views on Vision4Press platform.
Data correspond to usage on the plateform after 2015. The current usage metrics is available 48-96 hours after online publication and is updated daily on week days.
Initial download of the metrics may take a while.