Open Access
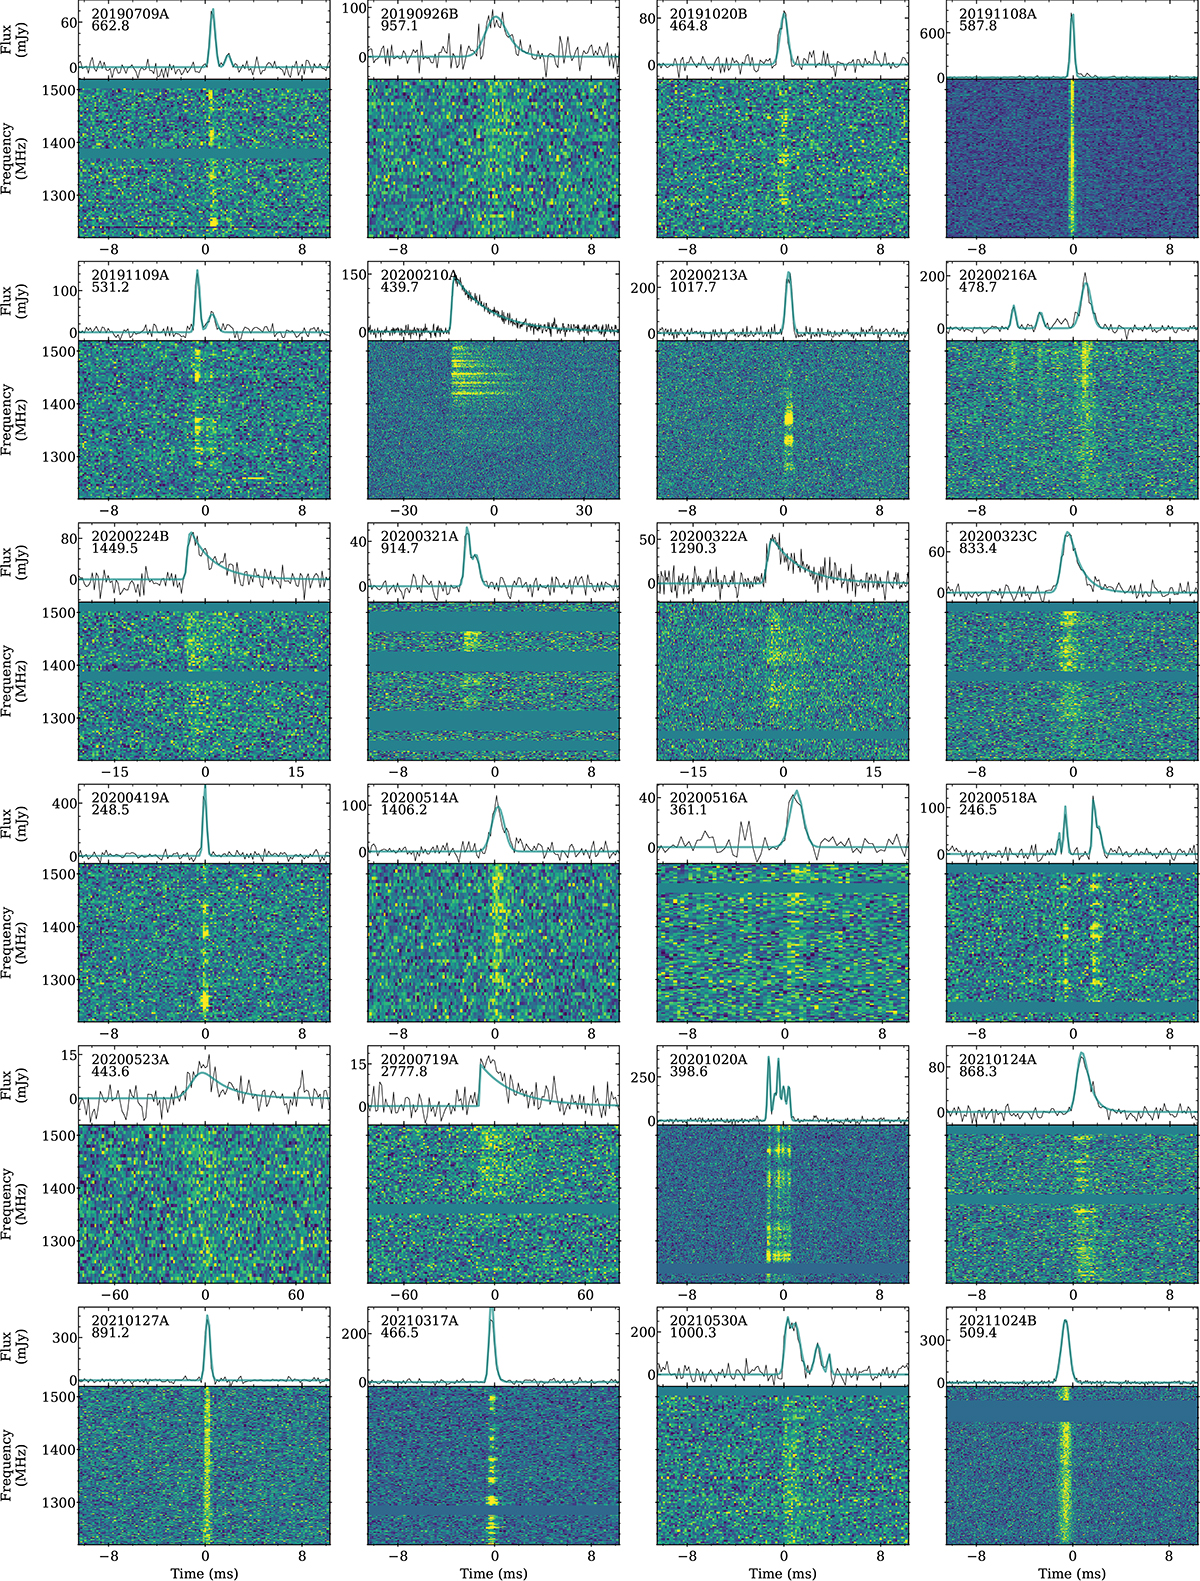
Fig. 3.
Download original image
Dynamic spectra of all FRBs detected with Apertif. Top panels: Averaged pulse profile in black, and fitted profile in teal. Each top left corner contains the name from the TNS, and the applied DM in pc cm−3. Bottom panels: Dynamic spectrum, rebinned in time and frequency to optimise burst visibility.
Current usage metrics show cumulative count of Article Views (full-text article views including HTML views, PDF and ePub downloads, according to the available data) and Abstracts Views on Vision4Press platform.
Data correspond to usage on the plateform after 2015. The current usage metrics is available 48-96 hours after online publication and is updated daily on week days.
Initial download of the metrics may take a while.