Fig. A.1.
Download original image
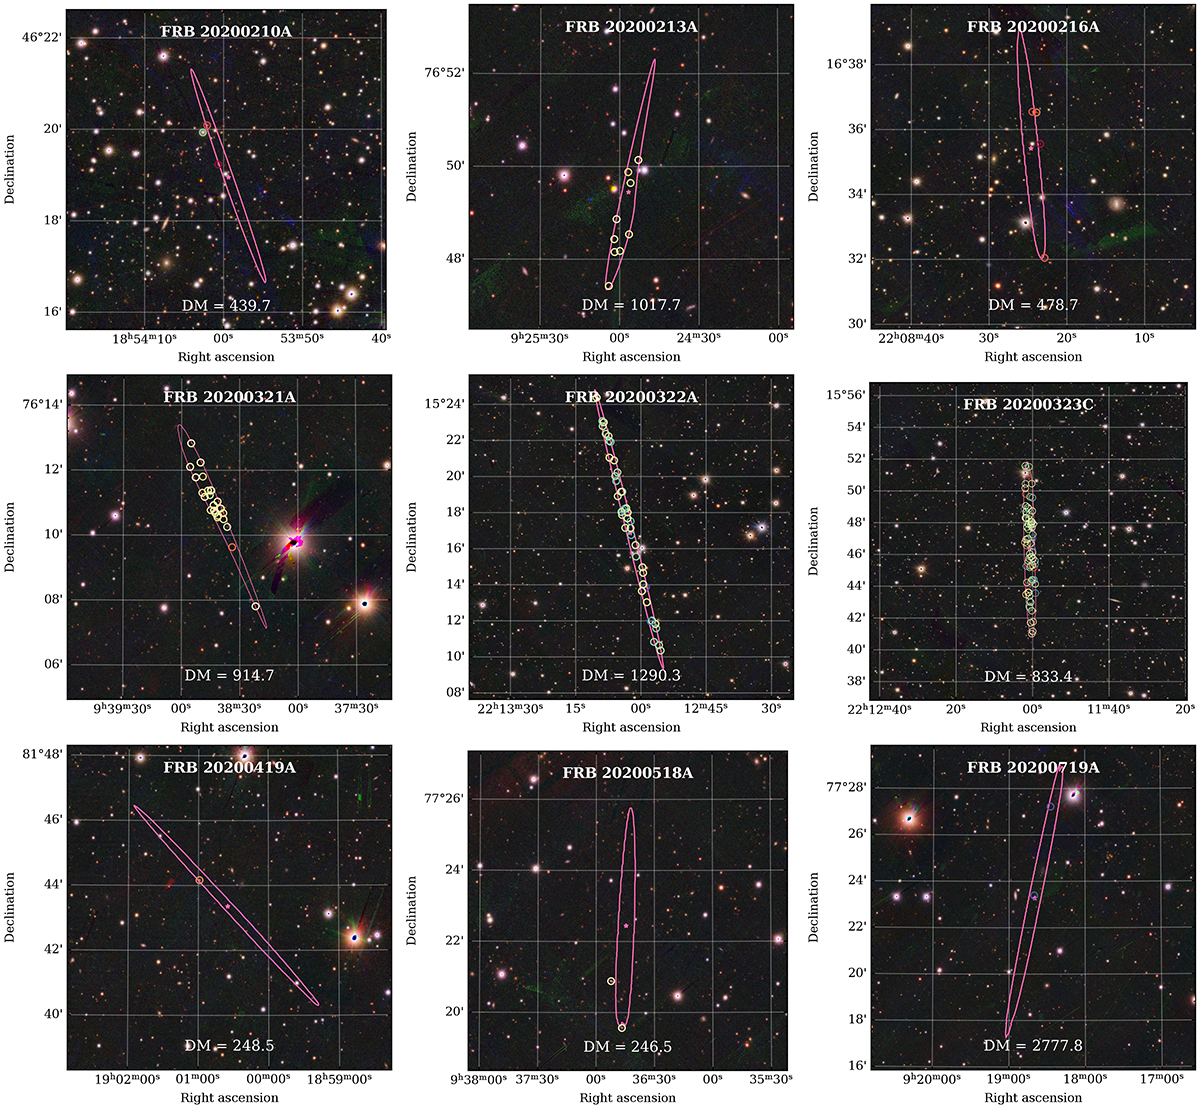
Localisation regions of the new Apertif FRBs with an error region < 6 arcmin2. In each subplot, the pink contour represents the 99% confidence region of the localisation, and the pink star the centroid of the error region. The circles show the PS1-STRM galaxies identified within or close to the error region and redshift range of each FRB, with colours from blue to red as redshift increases. The text on top of each plot gives the TNS identifier of each FRB, and the bottom text the DM in units of pc cm−3. The background images are from the PanSTARRS DR1 (Chambers et al. 2019). In each plot, the grids are spaced by 2 arcmin in declination.
Current usage metrics show cumulative count of Article Views (full-text article views including HTML views, PDF and ePub downloads, according to the available data) and Abstracts Views on Vision4Press platform.
Data correspond to usage on the plateform after 2015. The current usage metrics is available 48-96 hours after online publication and is updated daily on week days.
Initial download of the metrics may take a while.