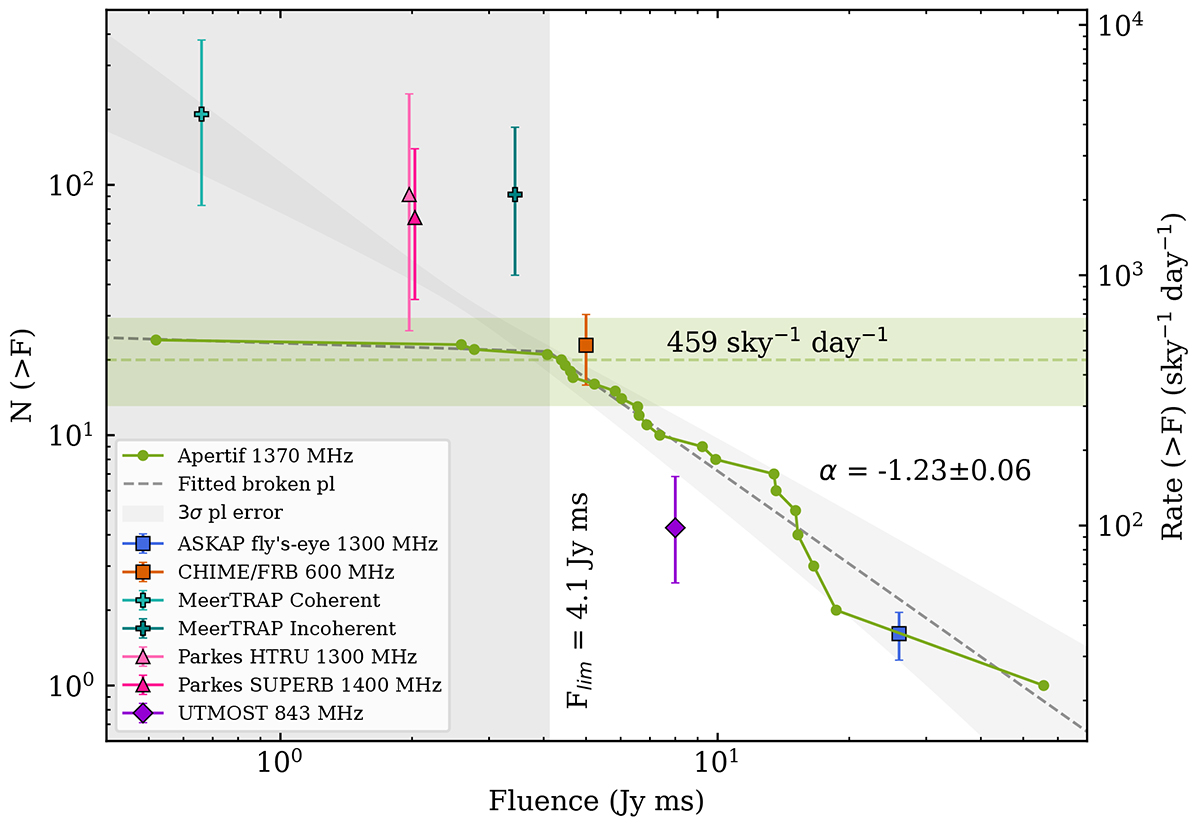
Fig. 24.
Download original image
Cumulative fluence distribution of the Apertif FRBs. The left and right ordinate are related through Eq. (16). The green dots give the measured FRB fluences, and the grey dashed line their fit to a broken power-law. The diagonal grey shaded region gives the 3σ confidence interval of the power-law above the fluence limit extrapolated to other fluences. The vertical grey shaded region is below the fluence completeness threshold of 4.1 Jy ms, while the horizontal green shaded region gives the all-sky FRB rate above that fluence, with Poissonian 95% confidence limits. The markers denote all-sky rates estimated by the surveys in the legend and main text.
Current usage metrics show cumulative count of Article Views (full-text article views including HTML views, PDF and ePub downloads, according to the available data) and Abstracts Views on Vision4Press platform.
Data correspond to usage on the plateform after 2015. The current usage metrics is available 48-96 hours after online publication and is updated daily on week days.
Initial download of the metrics may take a while.