Fig. 18.
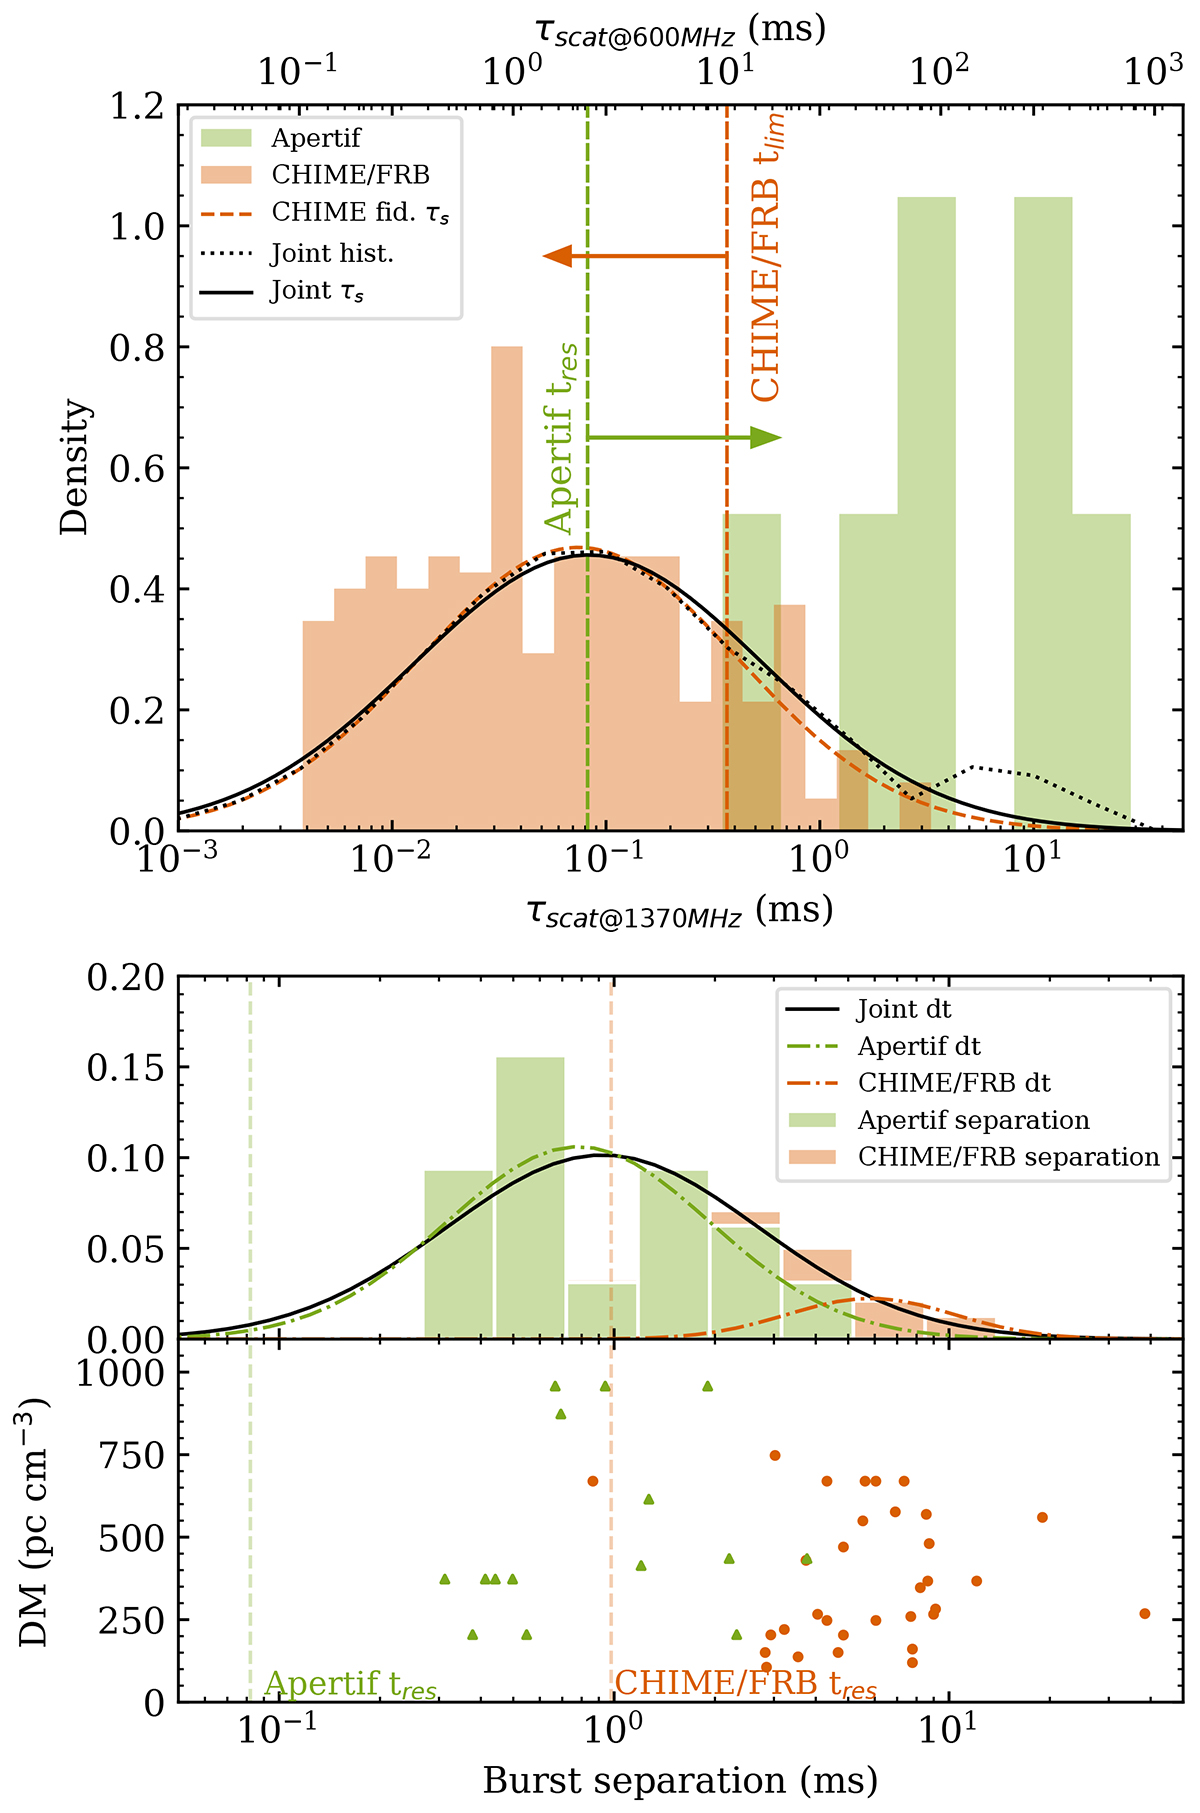
Download original image
Scattering and subcomponent separation distributions of Apertif and CHIME/FRB. Top: Histogram of observed scattering timescales in CHIME/FRB and Apertif FRBs. The dashed orange line represents the fiducial scattering timescale distribution of CHIME/FRB bursts. The dotted black line shows the joint scattering timescale distribution of Apertif and CHIME/FRB, and the solid black line its fit to a lognormal distribution. The dashed green and orange lines and arrows demarcate Apertif and CHIME/FRB sensitivity to scattering. The lower and upper horizontal axes show the scattering timescales scaled to the respective band centers of Apertif band (1370 MHz) and CHIME/FRB (600 MHz). Bottom: Joint stacked histogram of observed subcomponent separations. The green histogram represents the Apertif separation distribution normalised by the total number of components in the FRB sample. The orange histogram is the same for CHIME/FRB. The black line shows a fit of the joint histogram to a lognormal distribution.
Current usage metrics show cumulative count of Article Views (full-text article views including HTML views, PDF and ePub downloads, according to the available data) and Abstracts Views on Vision4Press platform.
Data correspond to usage on the plateform after 2015. The current usage metrics is available 48-96 hours after online publication and is updated daily on week days.
Initial download of the metrics may take a while.