Open Access
Fig. 12.
Download original image
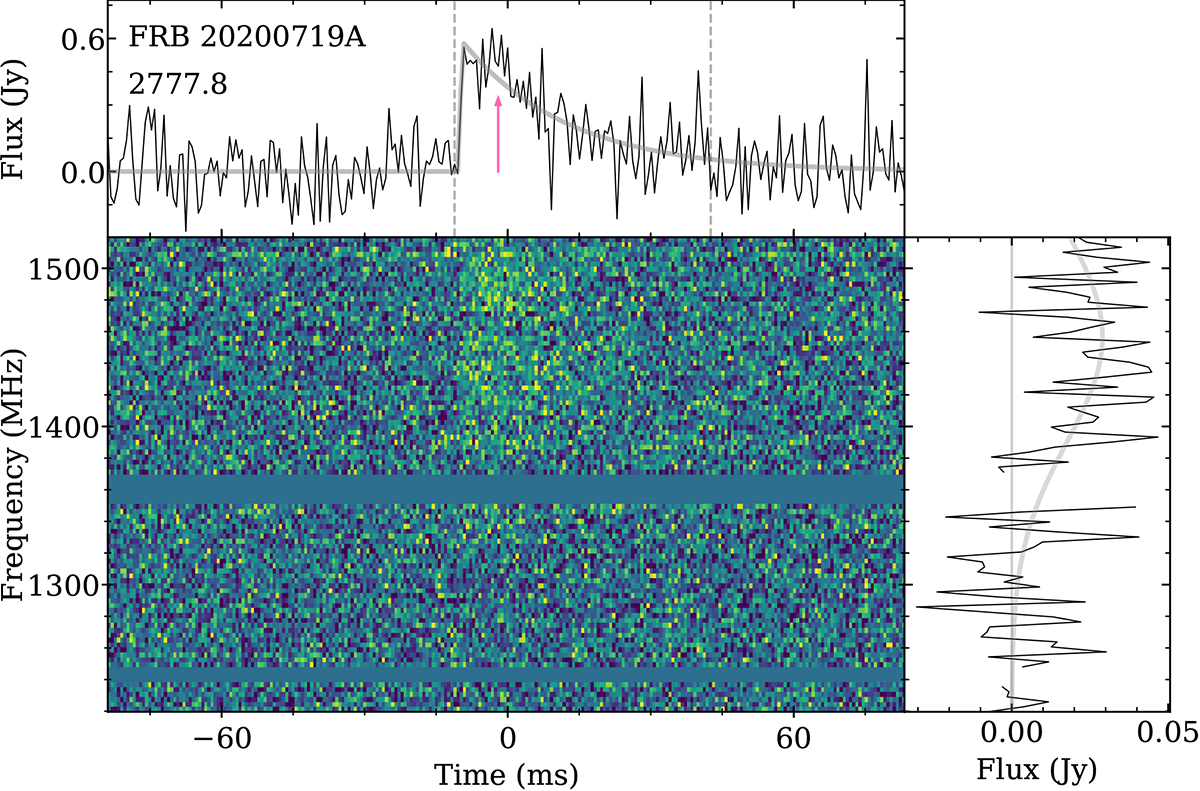
Dynamic spectrum of FRB 20200719A. The pulse profile is fitted to a scattered Gaussian. The pink arrow indicates the position of an excess emission that might be explained by a second component merged to the first by scattering. The spectrum is fitted to a Gaussian.
Current usage metrics show cumulative count of Article Views (full-text article views including HTML views, PDF and ePub downloads, according to the available data) and Abstracts Views on Vision4Press platform.
Data correspond to usage on the plateform after 2015. The current usage metrics is available 48-96 hours after online publication and is updated daily on week days.
Initial download of the metrics may take a while.