Open Access
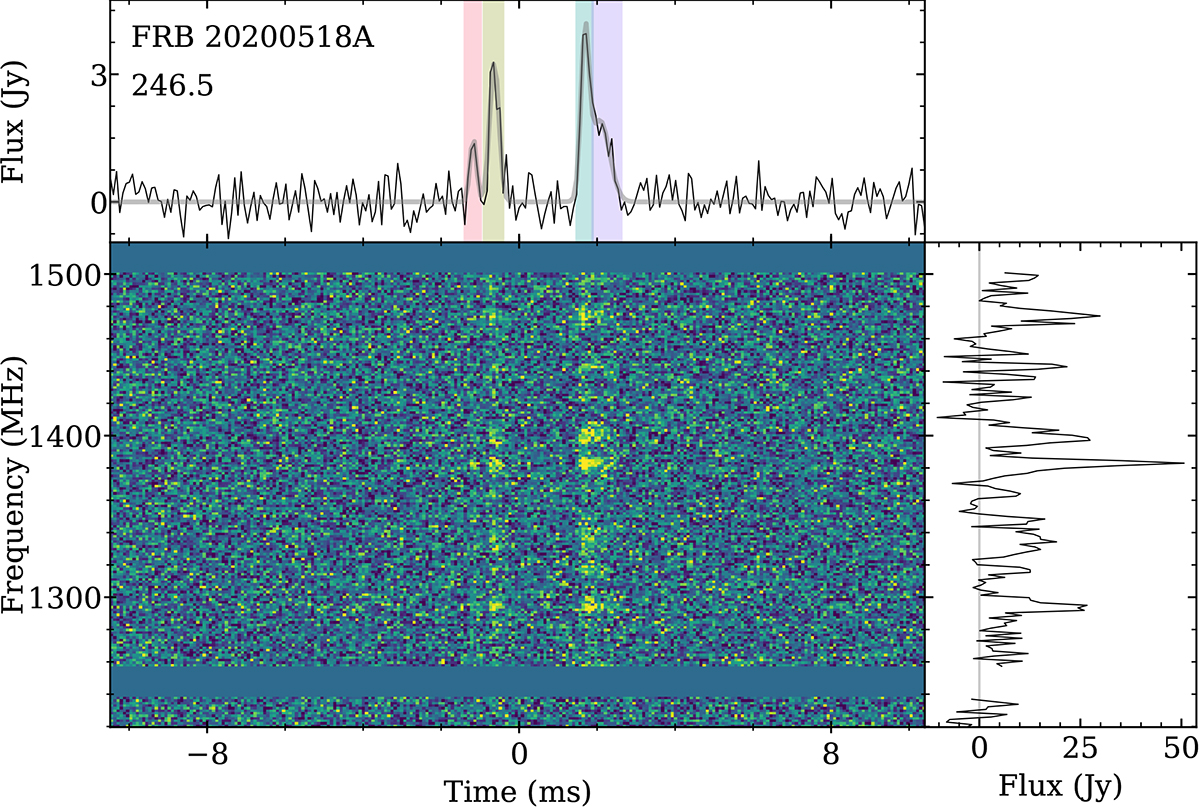
Fig. 10.
Download original image
Dynamic spectrum of FRB 20200518A. In the pulse profile, each of the four components is marked by a coloured region, and is fitted to a Gaussian. The spectrum in the bottom right panel is the sum of all the components.
Current usage metrics show cumulative count of Article Views (full-text article views including HTML views, PDF and ePub downloads, according to the available data) and Abstracts Views on Vision4Press platform.
Data correspond to usage on the plateform after 2015. The current usage metrics is available 48-96 hours after online publication and is updated daily on week days.
Initial download of the metrics may take a while.