Fig. 9.
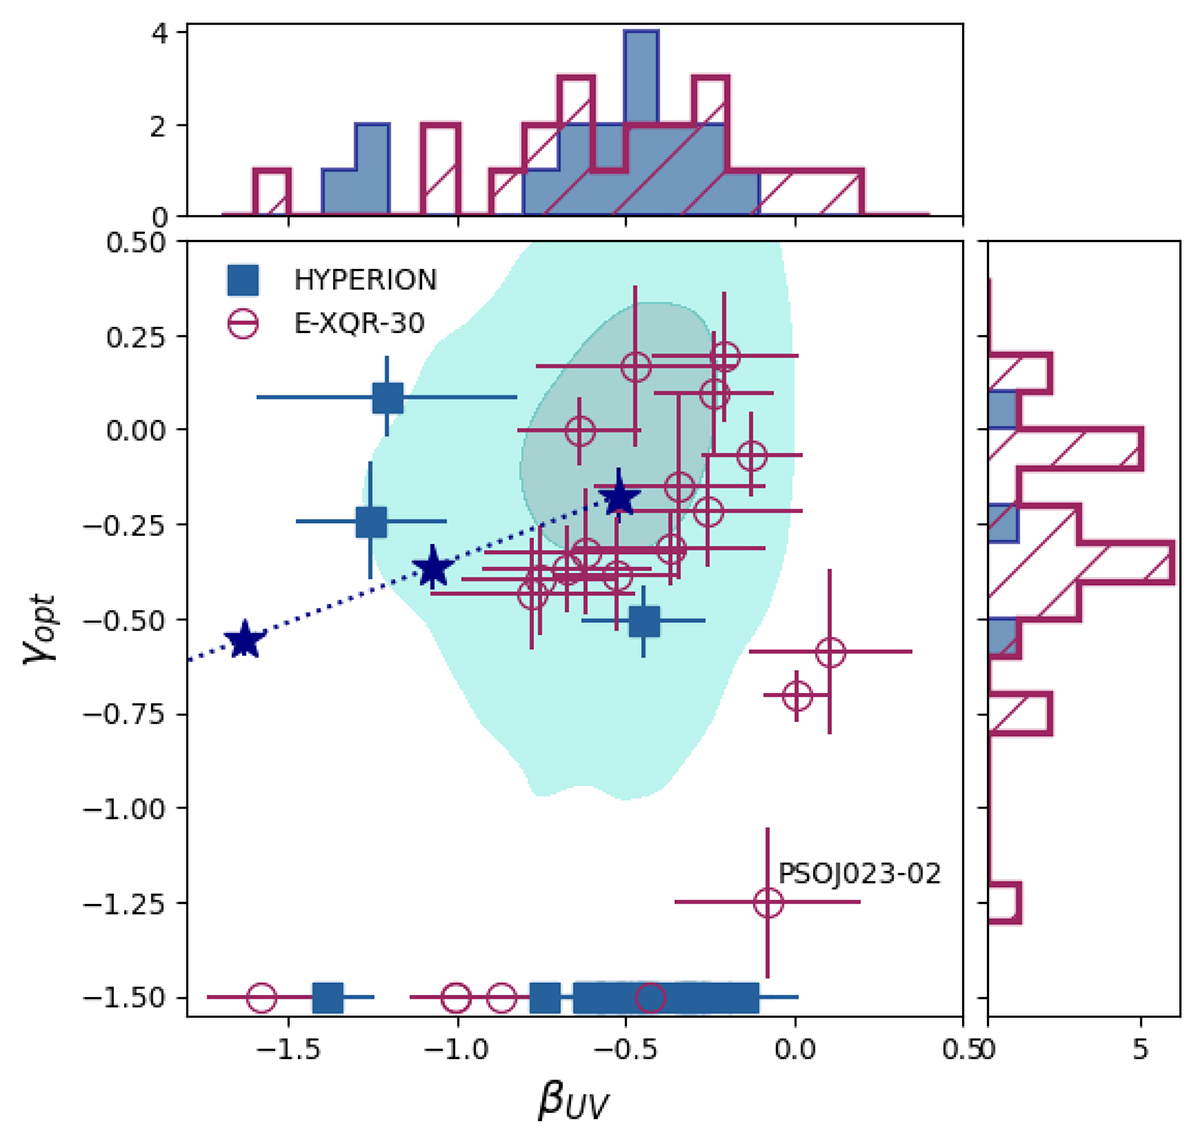
Download original image
βUV (1300 < λ/Å < 3000) and γopt (3000 < λ/Å < 10 000) distributions for the sample. Only the UV slope has been measured for the points along the constant line γopt = −1.5. Blue stars represent the values obtained from the lum-K13 template assuming E[B − V] values of 0, 0.05, and 0.1, and assuming observations in the UKIDSS YJHK bands plus W1 and W2 for QSOs at 5.5 ≥ z ≥ 7.5. The shaded light-blue areas delimit the 1 and 2σ confidence intervals for the luminous QSO subsample in Krawczyk et al. (2013).
Current usage metrics show cumulative count of Article Views (full-text article views including HTML views, PDF and ePub downloads, according to the available data) and Abstracts Views on Vision4Press platform.
Data correspond to usage on the plateform after 2015. The current usage metrics is available 48-96 hours after online publication and is updated daily on week days.
Initial download of the metrics may take a while.