Open Access
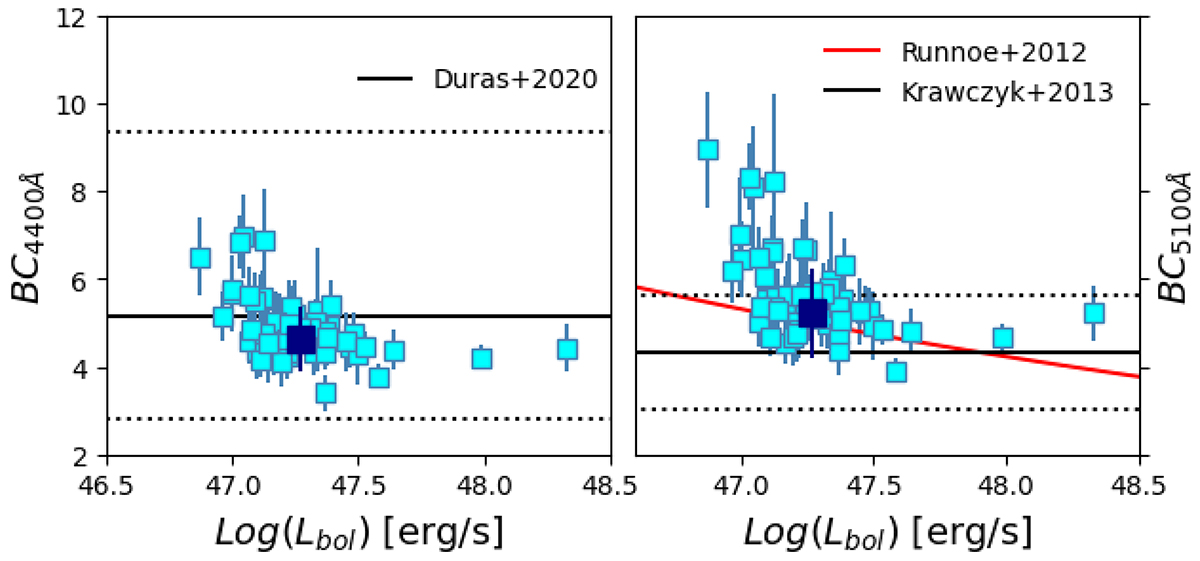
Fig. 7.
Download original image
Bolometric corrections at 4400 (left) and 5100 Å (right) with their weighted mean values reported as blue squares. Overplotted are the relationships by Duras et al. (2020), Krawczyk et al. (2013, with the associated uncertainties as dotted lines), and Runnoe et al. (2012).
Current usage metrics show cumulative count of Article Views (full-text article views including HTML views, PDF and ePub downloads, according to the available data) and Abstracts Views on Vision4Press platform.
Data correspond to usage on the plateform after 2015. The current usage metrics is available 48-96 hours after online publication and is updated daily on week days.
Initial download of the metrics may take a while.