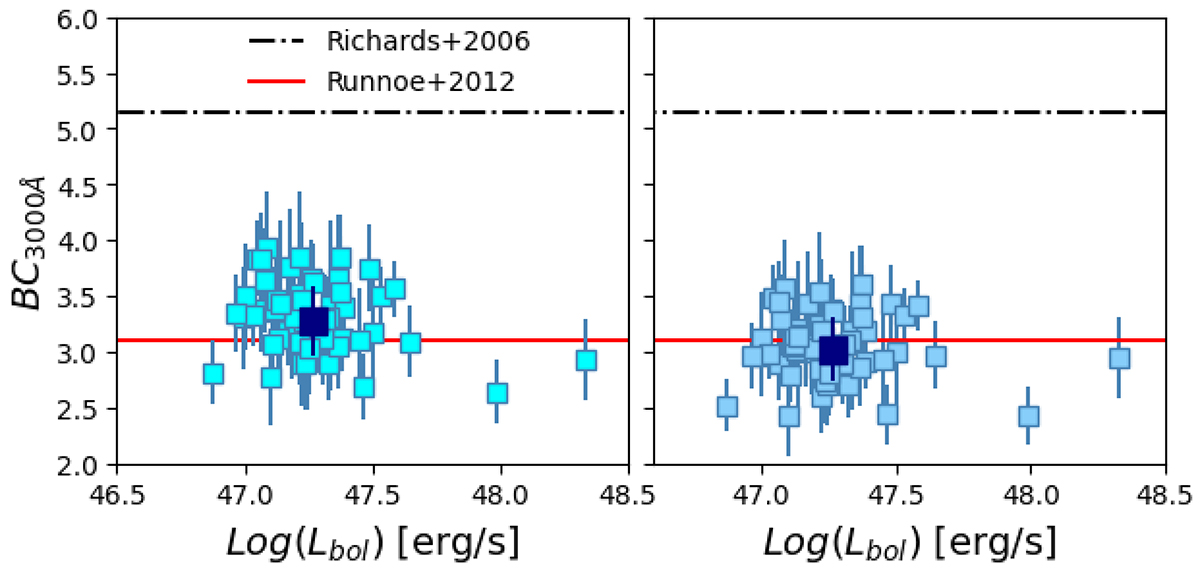
Fig. 6.
Download original image
BC3000 Å vs Lbol for HYPERION and E-XQR-30 QSOs with their weighted mean value reported as a dark-blue square. The left panel illustrates Lbol computation using Eq. (3), while the right panel showcases results obtained through the lum-K13 modeling of the EUV. The constant 3000 Å BCs proposed by Richards et al. (2006) are overplotted. The original value of 5.15 is depicted as a black dot-dashed line while, the version recomputed by Runnoe et al. (2012) to exclude IR emission is represented as a red solid line.
Current usage metrics show cumulative count of Article Views (full-text article views including HTML views, PDF and ePub downloads, according to the available data) and Abstracts Views on Vision4Press platform.
Data correspond to usage on the plateform after 2015. The current usage metrics is available 48-96 hours after online publication and is updated daily on week days.
Initial download of the metrics may take a while.