Open Access
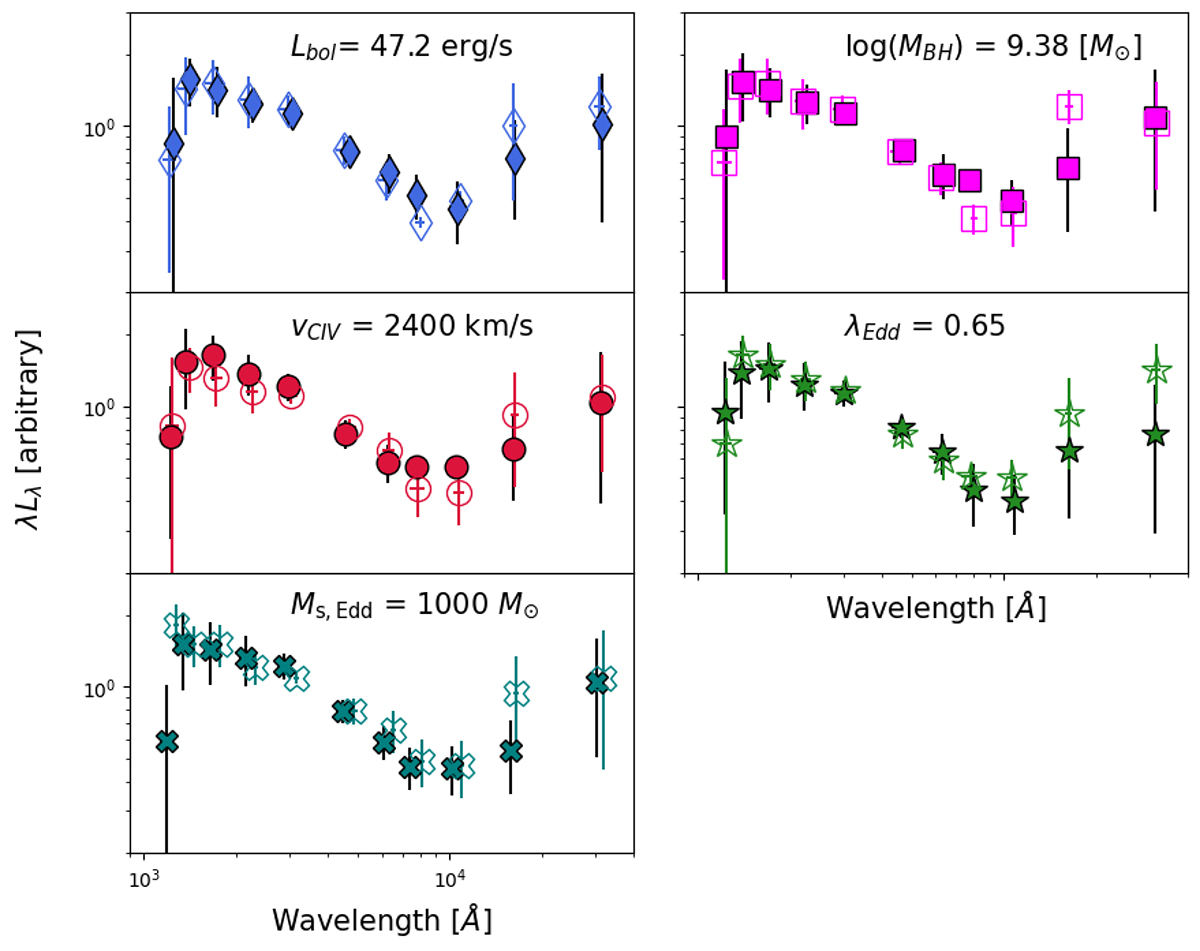
Fig. 14.
Download original image
Mean SEDs derived by splitting the sample according to the median value of several physical properties. Each panel reports the threshold value used to split the sample. Filled markers refer to QSOs above the threshold, while empty ones indicate QSOs below the threshold.
Current usage metrics show cumulative count of Article Views (full-text article views including HTML views, PDF and ePub downloads, according to the available data) and Abstracts Views on Vision4Press platform.
Data correspond to usage on the plateform after 2015. The current usage metrics is available 48-96 hours after online publication and is updated daily on week days.
Initial download of the metrics may take a while.