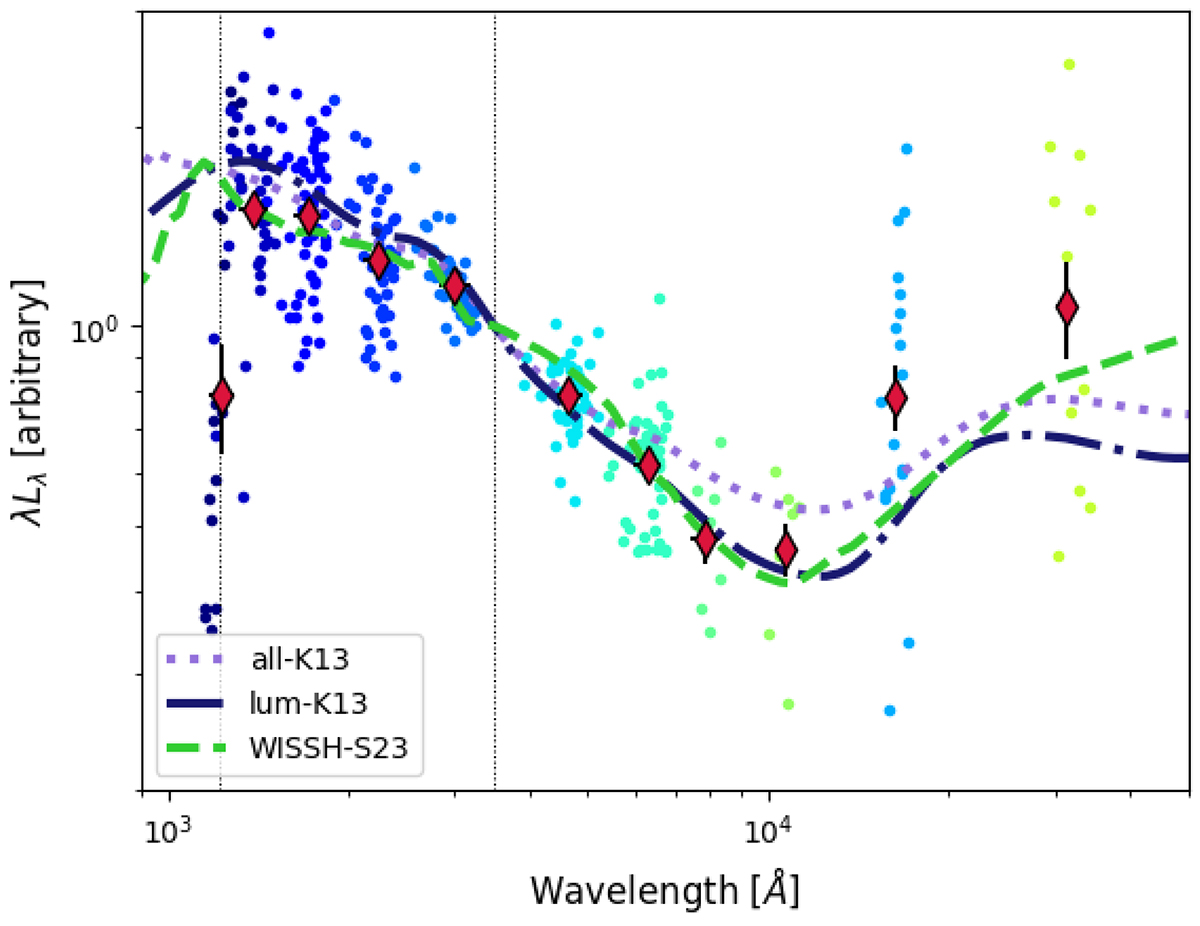
Fig. 12.
Download original image
Photometry points for the HYPERION and E-XQR-30 samples, normalized at λ = 3500 Å. The red diamonds show the geometric mean value for each band with the associated 1σ as an error bar. Overplotted are also the mean SEDs by Krawczyk et al. (2013) (whole and luminous QSOs samples, purple dotted and blue dot-dashed lines, respectively) and the WISSH hyperluminous mean SED (dashed green line). The vertical dotted lines indicate the position of the Lyα at 1216 Å and the normalization wavelength.
Current usage metrics show cumulative count of Article Views (full-text article views including HTML views, PDF and ePub downloads, according to the available data) and Abstracts Views on Vision4Press platform.
Data correspond to usage on the plateform after 2015. The current usage metrics is available 48-96 hours after online publication and is updated daily on week days.
Initial download of the metrics may take a while.