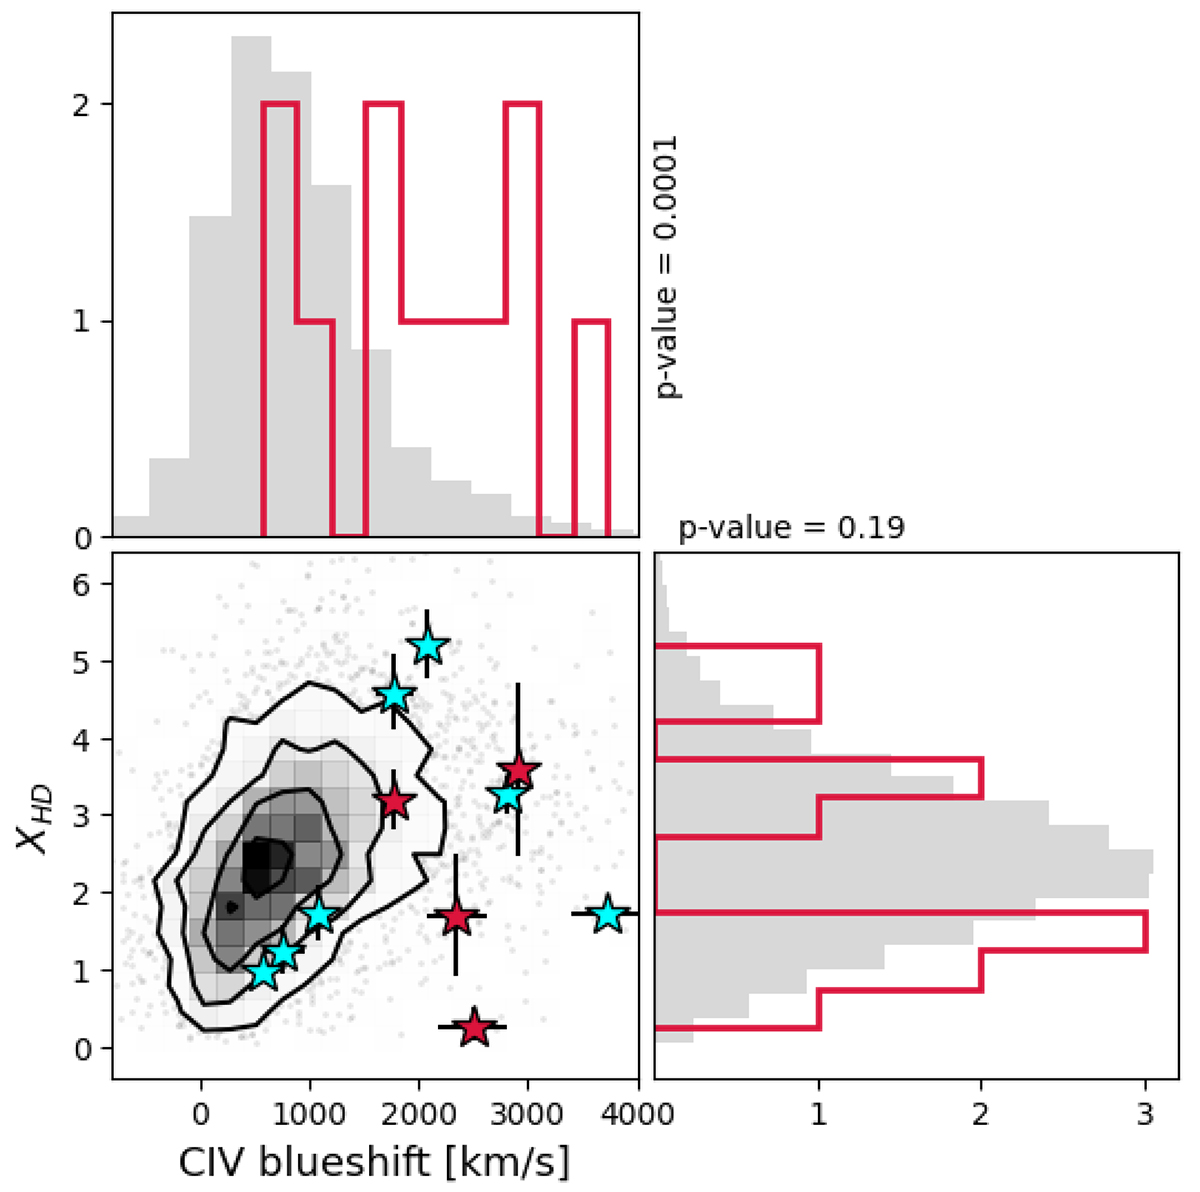
Fig. 11.
Download original image
XHD vs CIV blueshift adapted from Fig. 3 in Temple et al. (2021b) with the inclusion of HYPERION and XQR-30 QSOs. E-XQR-30 blueshifts are taken from Mazzucchelli et al. (2023), while HYPERION values are computed as the mean of all the blueshifts reported in the literature for each QSO; see Tortosa et al. (2024). Errors on XHD are given as the 16th and 84th percentiles. Cyan stars indicate QSOs with Spitzer MIPS 24 μm fluxes, while red stars have W4 photometry. The histograms show the distributions of CIV blueshift and XHD in Temple et al. (2021b, shown here in gray, and normalized by a factor of 500) and for the HYPERION and E-XQR-30 QSOs (red). The p-values obtained by performing a K-S test on the two distributions are reported next to the histograms.
Current usage metrics show cumulative count of Article Views (full-text article views including HTML views, PDF and ePub downloads, according to the available data) and Abstracts Views on Vision4Press platform.
Data correspond to usage on the plateform after 2015. The current usage metrics is available 48-96 hours after online publication and is updated daily on week days.
Initial download of the metrics may take a while.