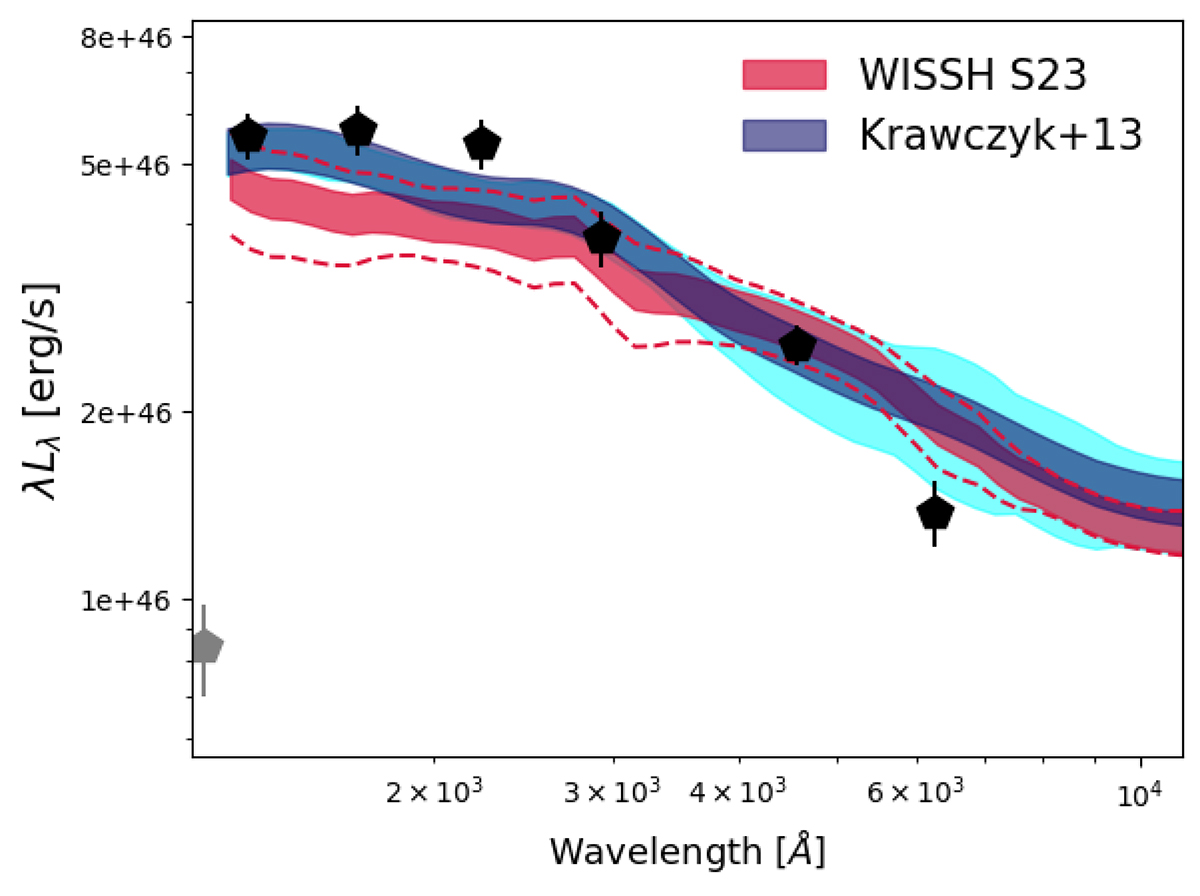
Fig. 1.
Download original image
SED fitting results for J083+11.8 at z = 6.346 using lum-K13 (blue) and WISSH-S23 (red) templates. The thickness of the lines denotes the ±1σ interval. Gray points denote photometry below the Lyα. The cyan shaded area and the dashed red lines denote the ±1σSED region associated to the best fit for the lum-K13 and WISSH samples, respectively; see Sect. 3.1.
Current usage metrics show cumulative count of Article Views (full-text article views including HTML views, PDF and ePub downloads, according to the available data) and Abstracts Views on Vision4Press platform.
Data correspond to usage on the plateform after 2015. The current usage metrics is available 48-96 hours after online publication and is updated daily on week days.
Initial download of the metrics may take a while.