Open Access
Fig. 6
Download original image
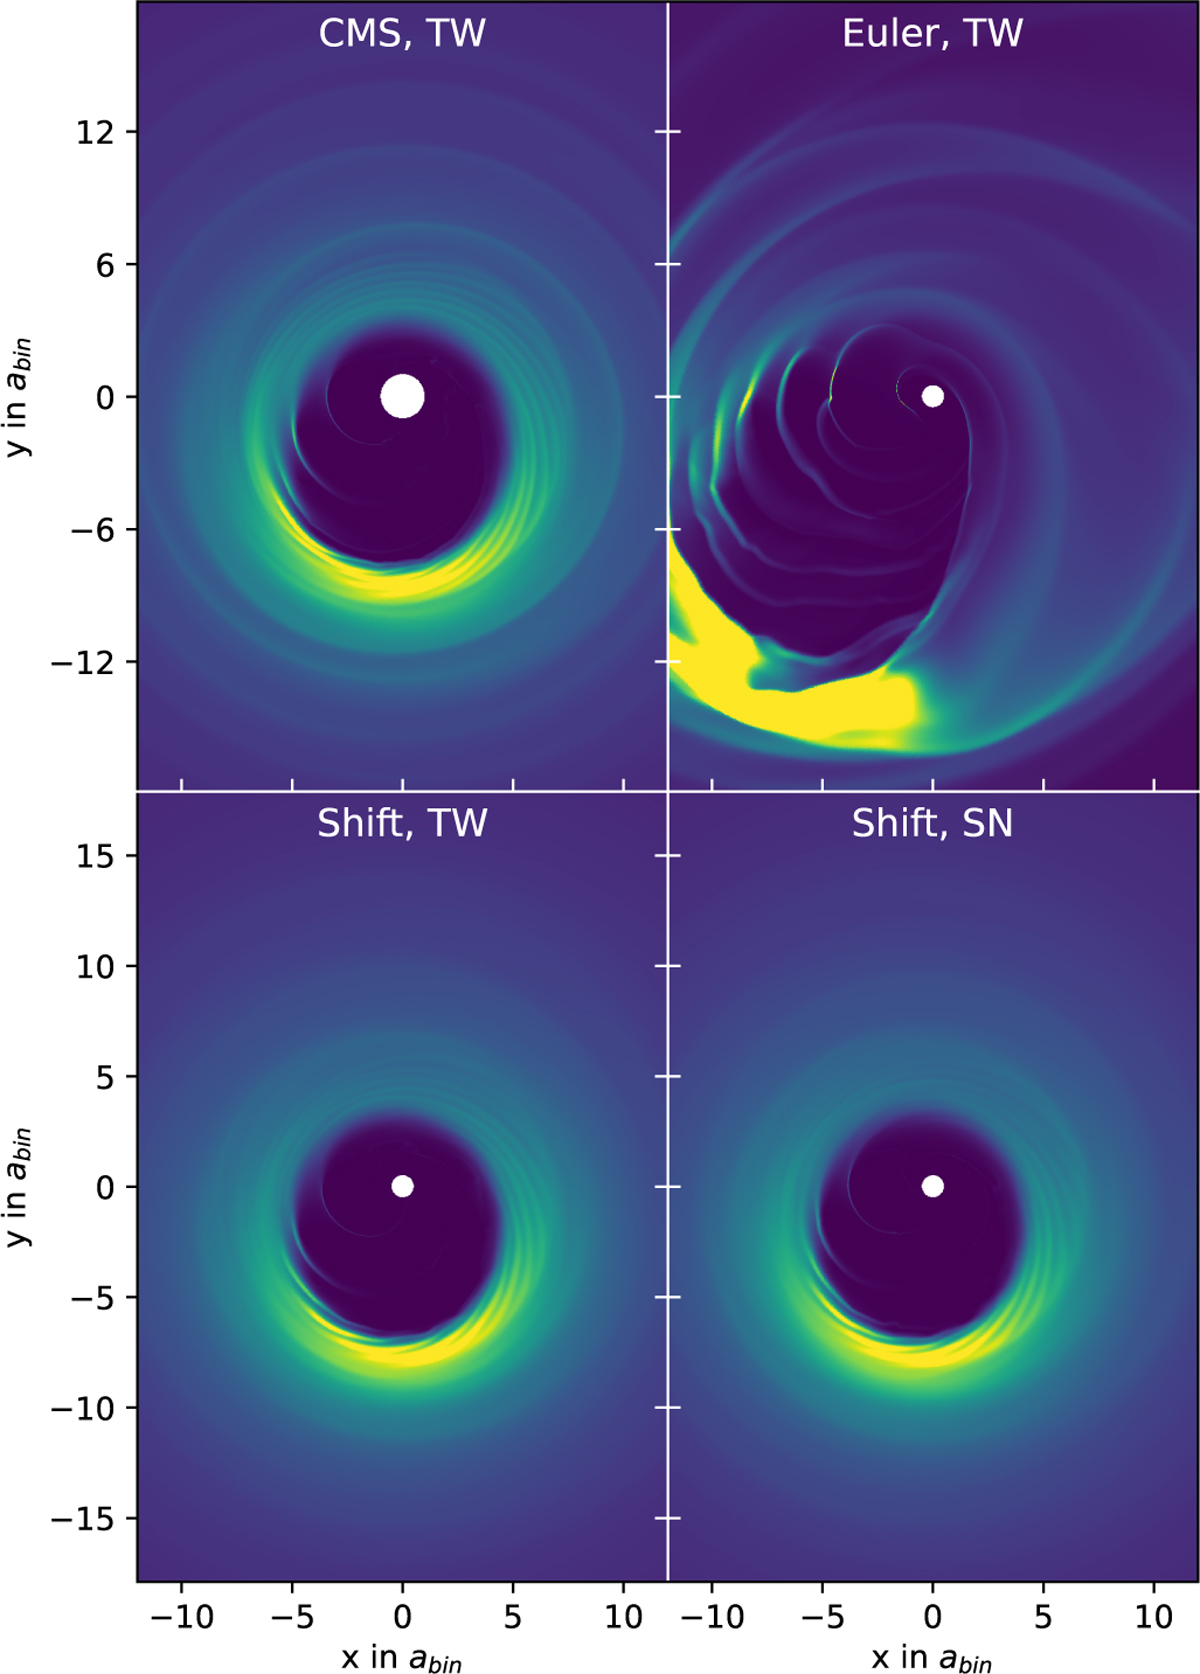
Snapshot of the surface densities of the high resolution simulations with a binary eccentricity of 0.4. We plot the simulation using the Euler indirect at a simulation time of t = 800 Tbin, and the other simulations at t = 4000 Tbin. All plots use the same linear color scale.
Current usage metrics show cumulative count of Article Views (full-text article views including HTML views, PDF and ePub downloads, according to the available data) and Abstracts Views on Vision4Press platform.
Data correspond to usage on the plateform after 2015. The current usage metrics is available 48-96 hours after online publication and is updated daily on week days.
Initial download of the metrics may take a while.