Open Access
Fig. 3
Download original image
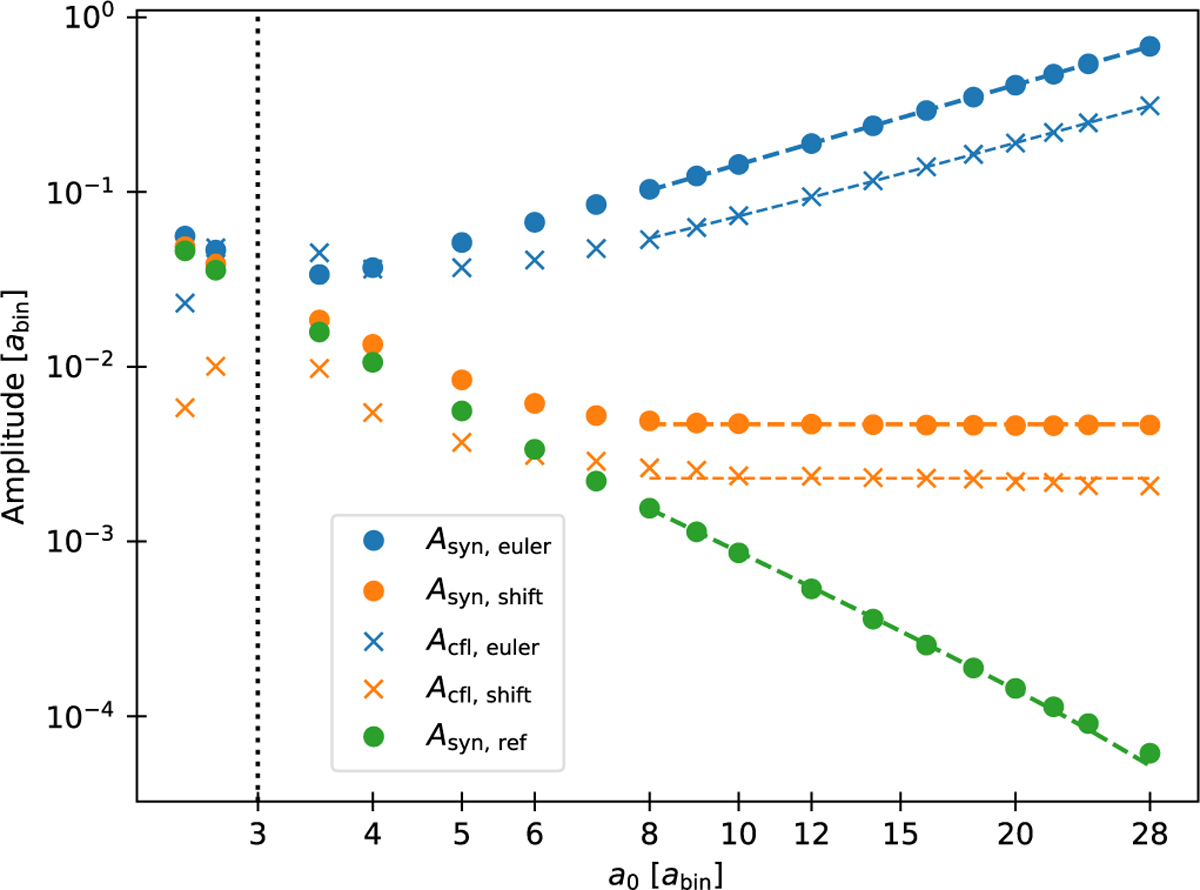
Amplitudes of the semi-major axis oscillations as a function of the initial semi-major axis. The dotted line at 3 abin indicates the initial position of the particle that is used for the time step criteria. The dashed lines represent the best least squares fit with a power law model.
Current usage metrics show cumulative count of Article Views (full-text article views including HTML views, PDF and ePub downloads, according to the available data) and Abstracts Views on Vision4Press platform.
Data correspond to usage on the plateform after 2015. The current usage metrics is available 48-96 hours after online publication and is updated daily on week days.
Initial download of the metrics may take a while.