Open Access
Fig. A.1
Download original image
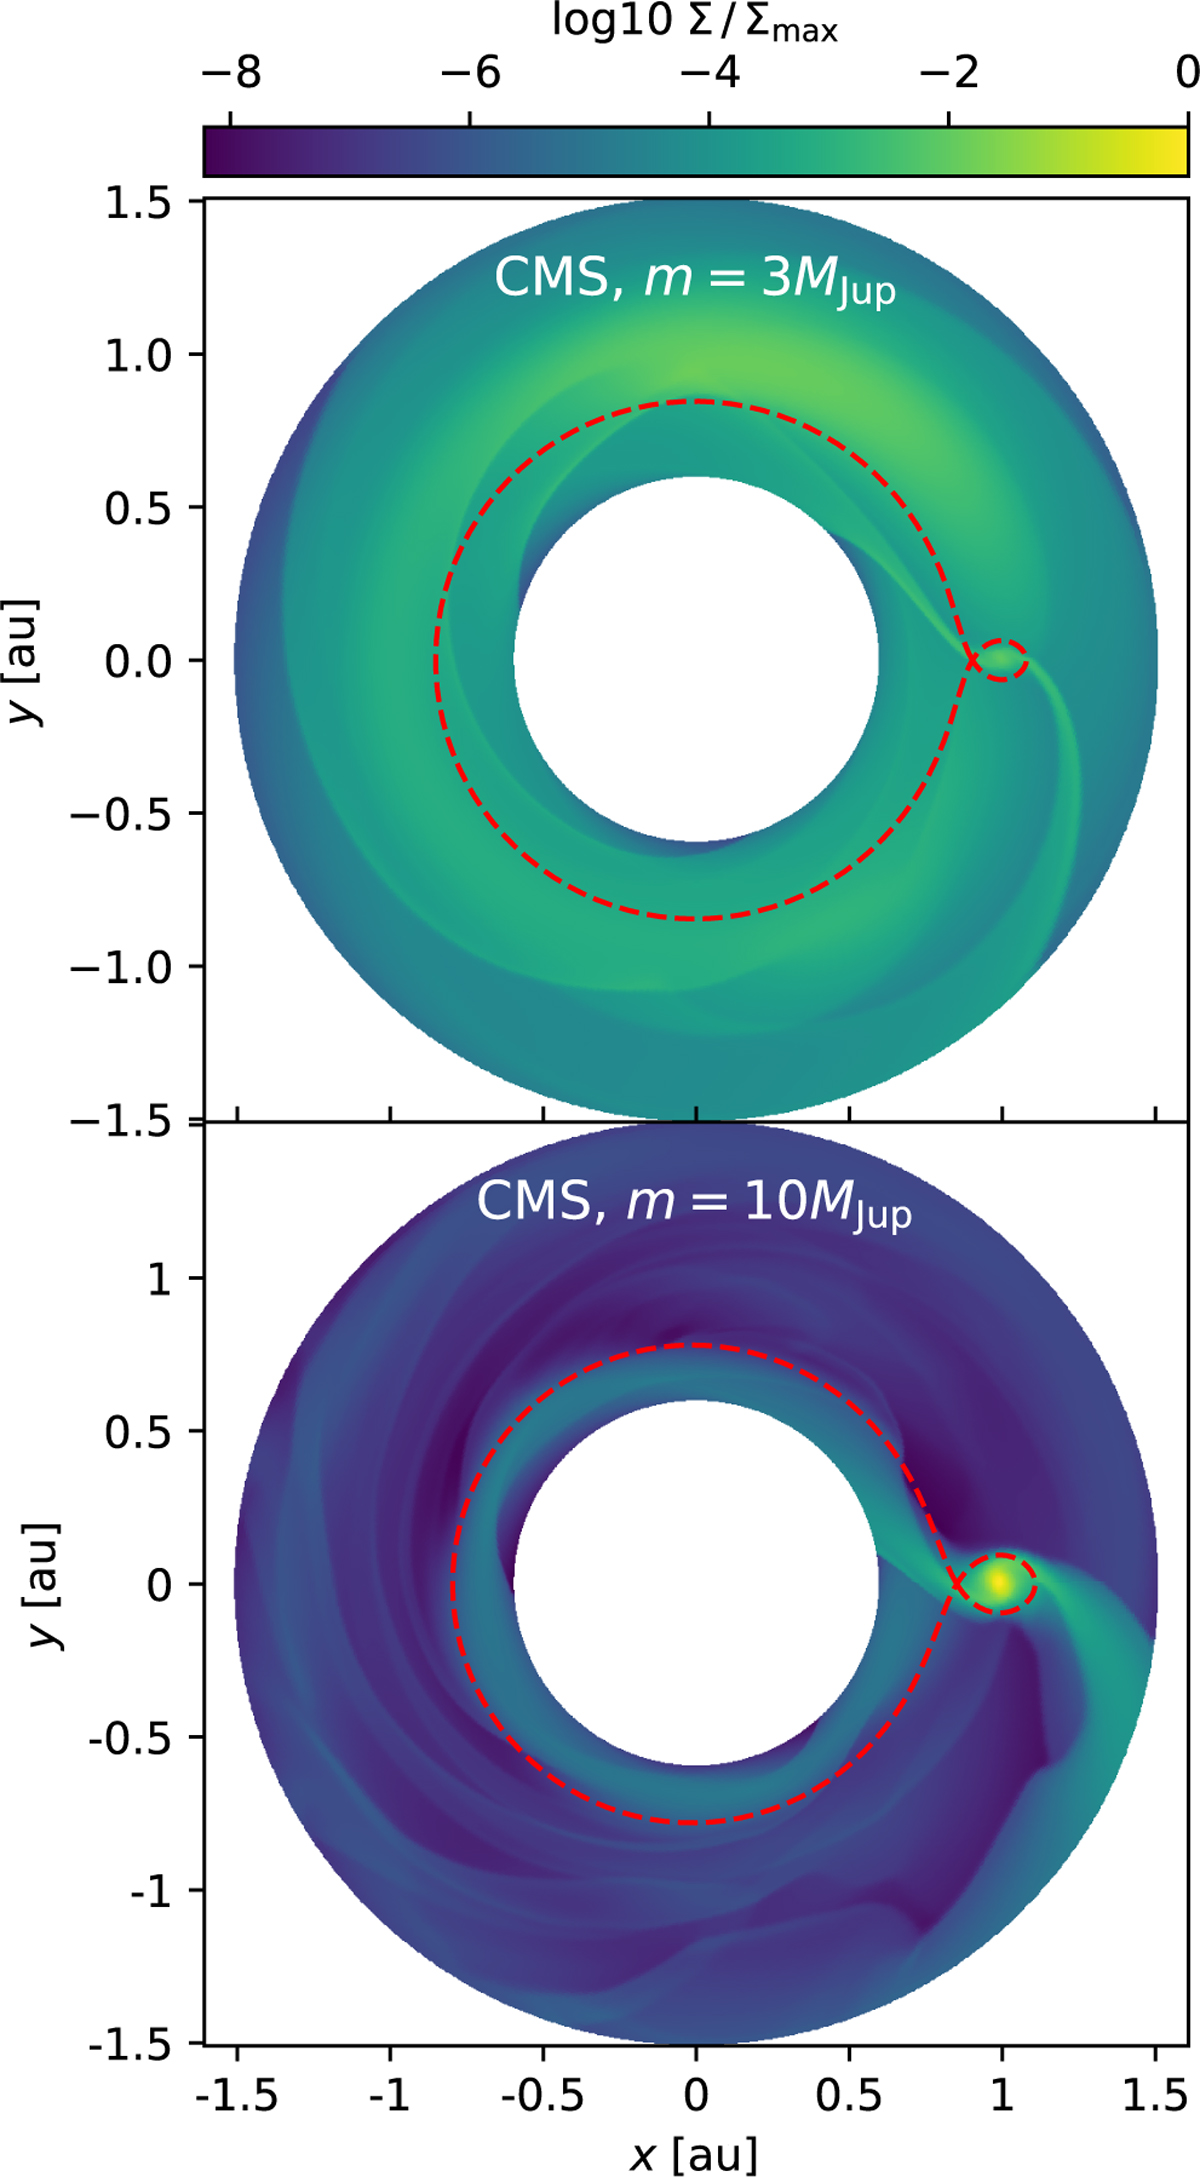
Surface densities after 200 orbital periods for different companion masses. The dashed cyan line represents the Roche lobe of the system. Both simulations were run in the center-of-mass frame and used the TW artificial viscosity. Both plots use the same color scale.
Current usage metrics show cumulative count of Article Views (full-text article views including HTML views, PDF and ePub downloads, according to the available data) and Abstracts Views on Vision4Press platform.
Data correspond to usage on the plateform after 2015. The current usage metrics is available 48-96 hours after online publication and is updated daily on week days.
Initial download of the metrics may take a while.