Open Access
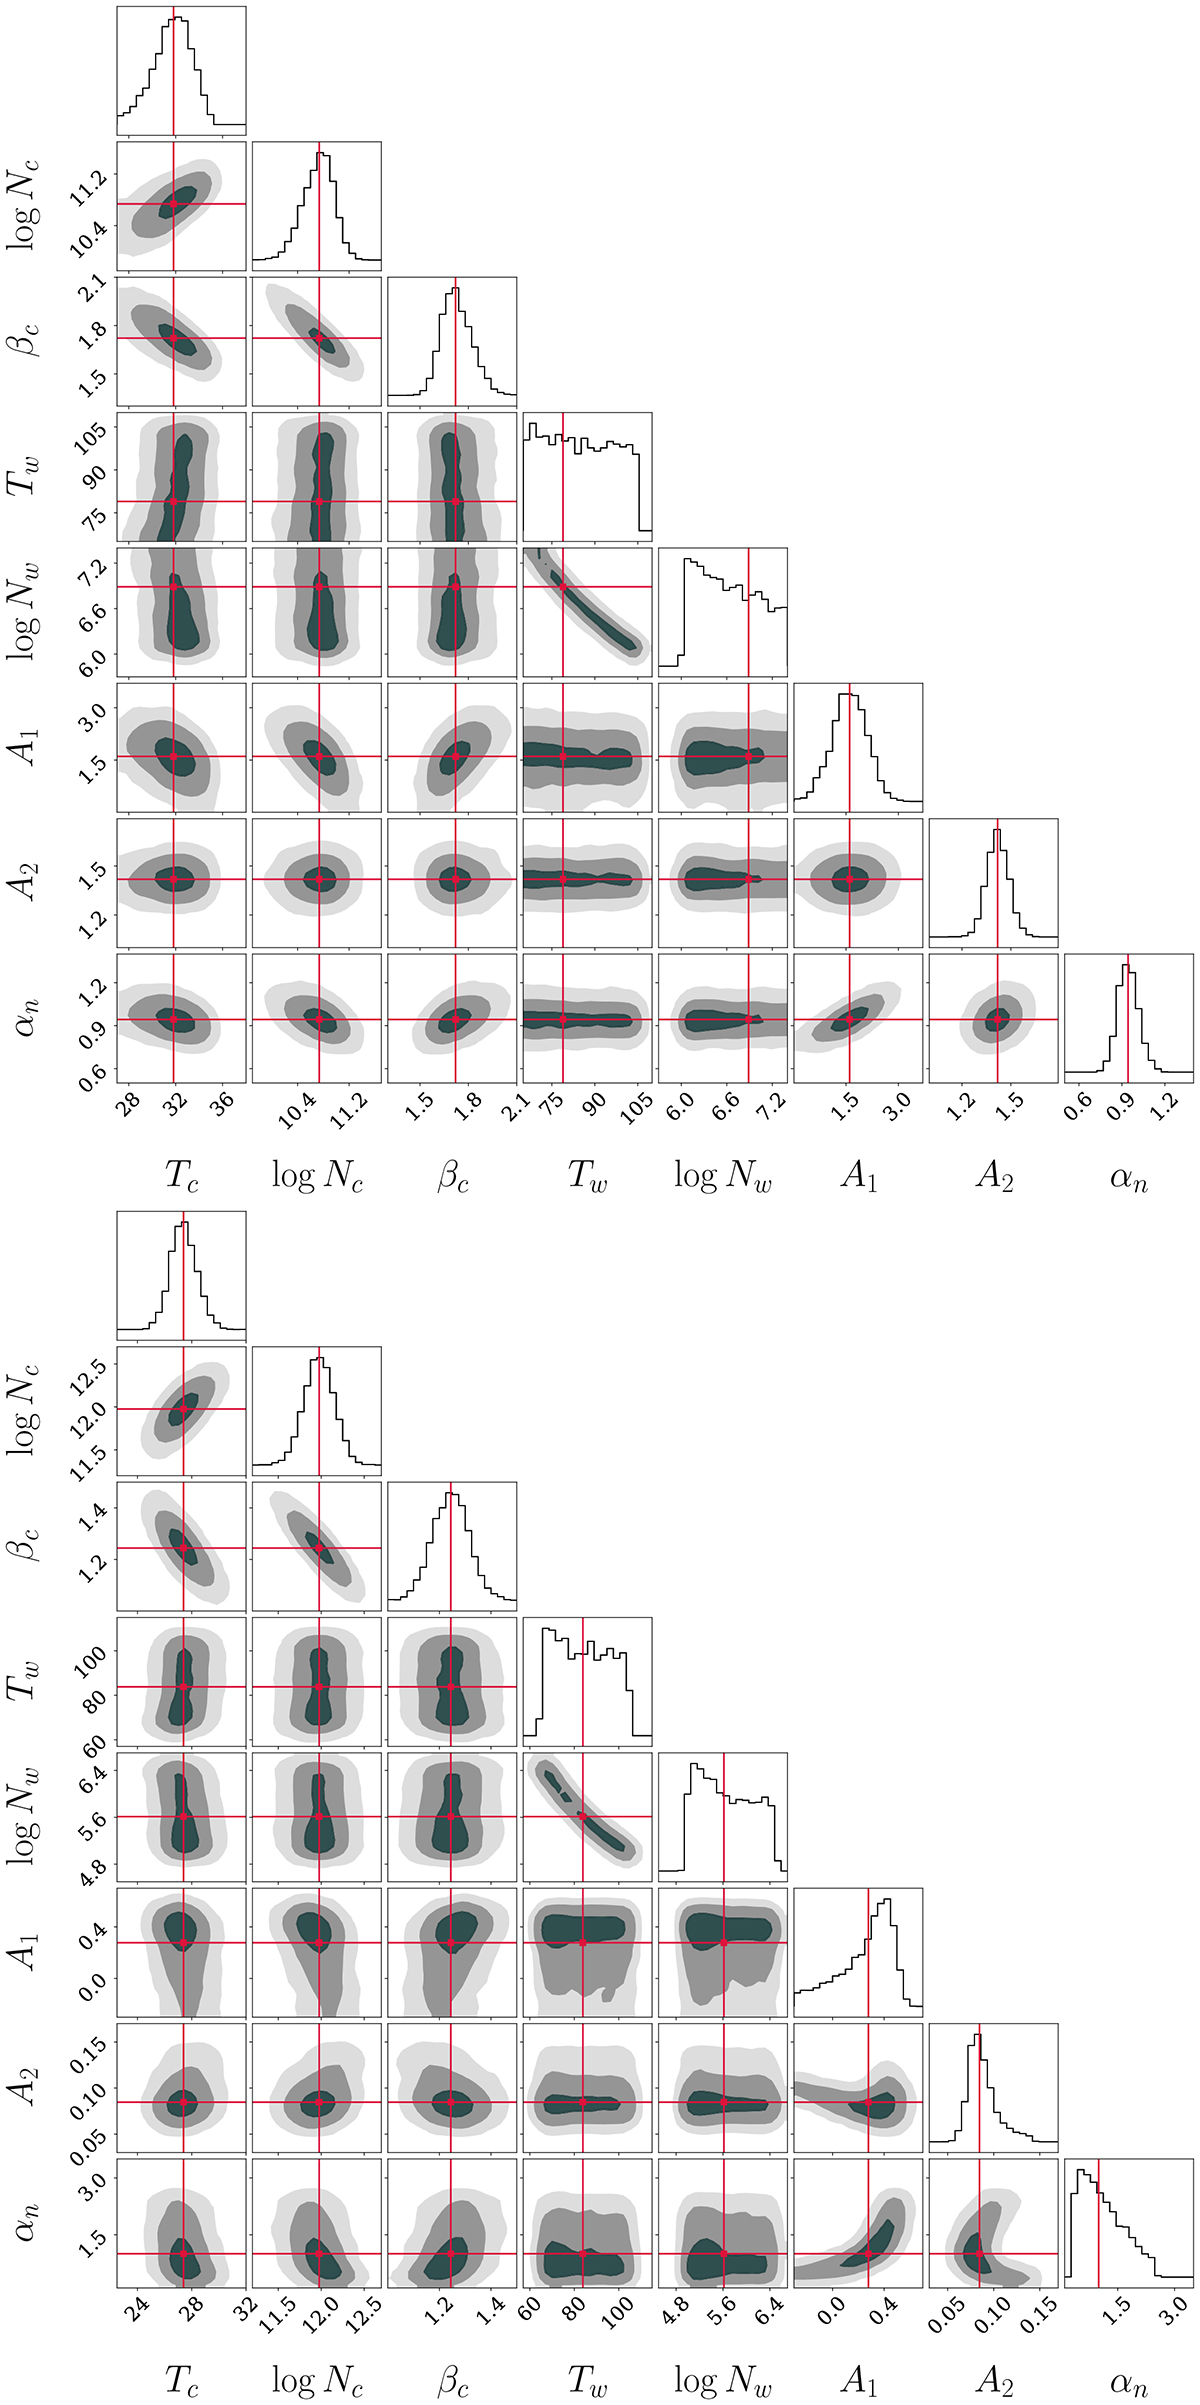
Fig. D.1.
Download original image
Corner plots of joint posterior PDFs as a result of the MCMC process, carried out for global SED modeling of (top) NGC 2146 and (bottom) NGC 2976. The median of each distribution function is shown with the red lines. We note that the axis for A1 is in units of 102 for clarity.
Current usage metrics show cumulative count of Article Views (full-text article views including HTML views, PDF and ePub downloads, according to the available data) and Abstracts Views on Vision4Press platform.
Data correspond to usage on the plateform after 2015. The current usage metrics is available 48-96 hours after online publication and is updated daily on week days.
Initial download of the metrics may take a while.