Fig. 2
Download original image
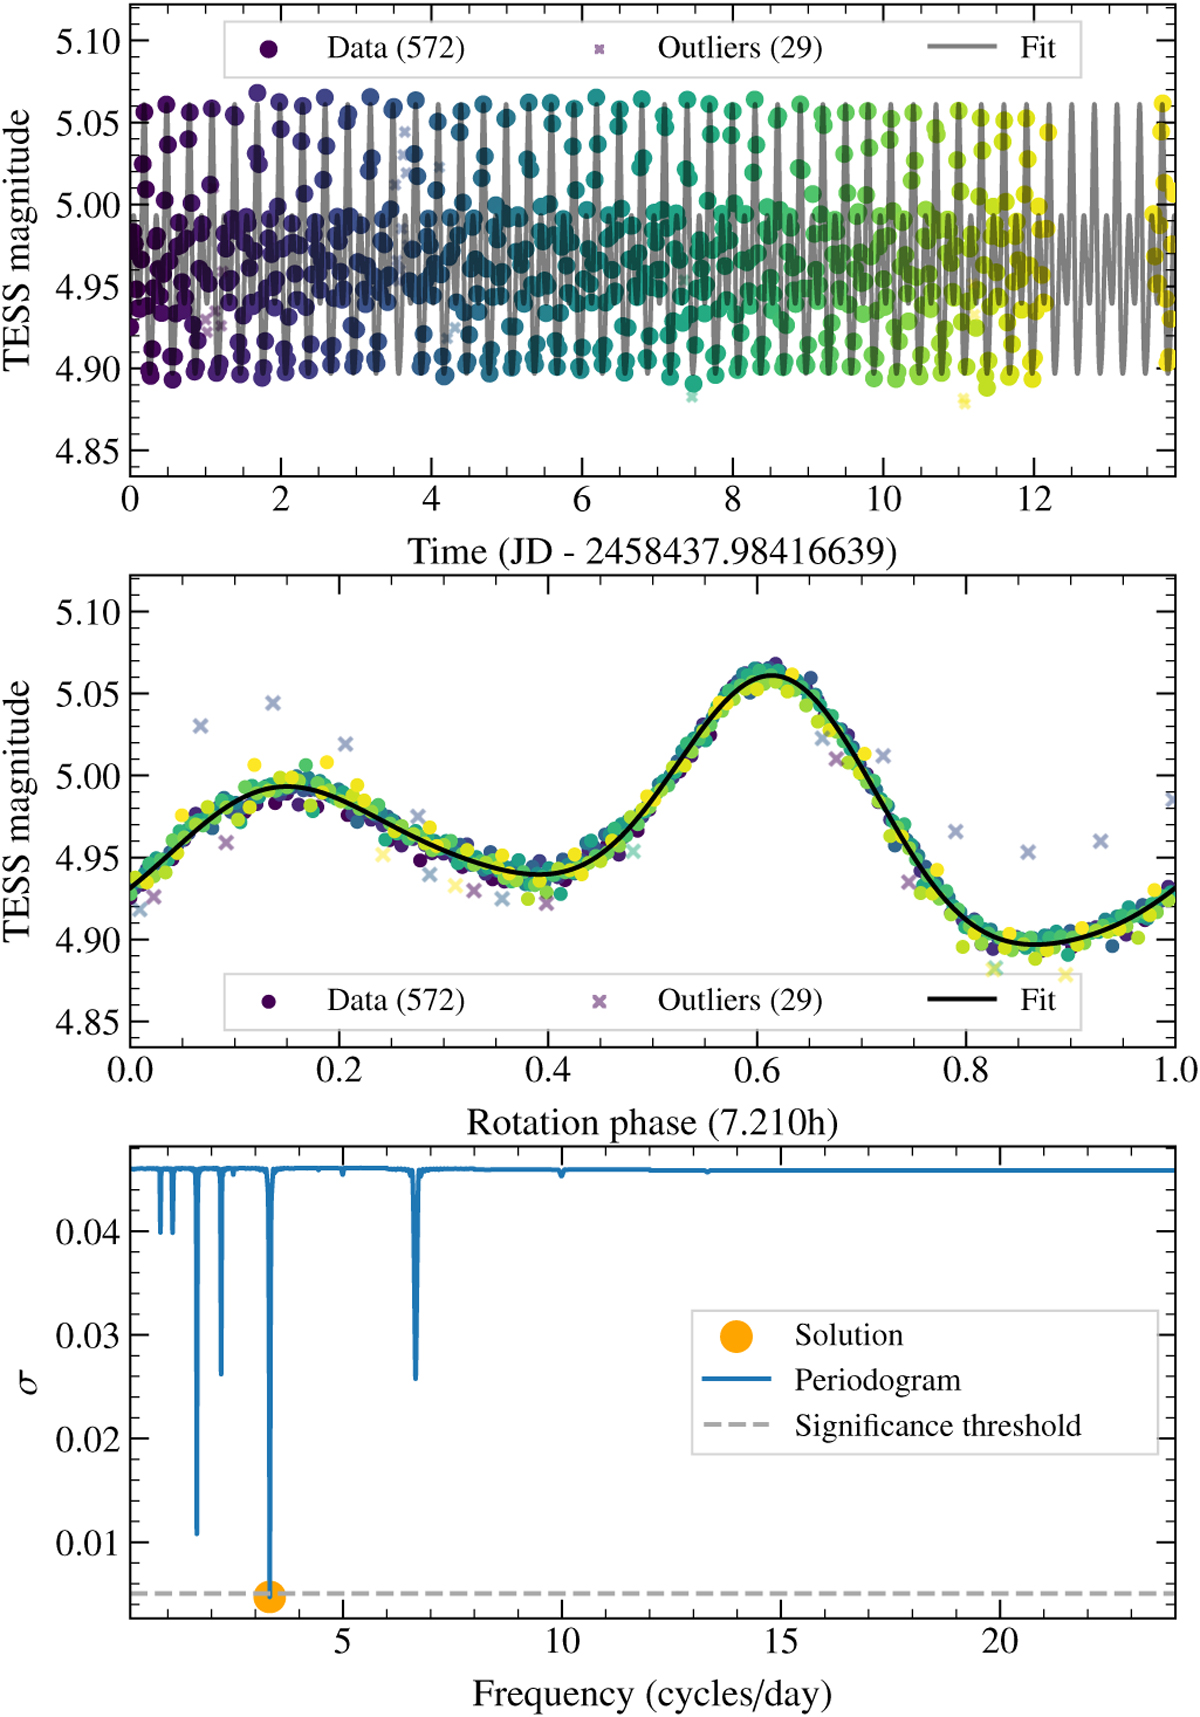
Example of light curve fit for asteroid (3) Juno. Top: TSSYS-DR1 data as function of time. Observations are plotted as dots, color-coded by epoch. Crosses represent data rejected by the fitting procedure (see text). The line represents the best fit. Middle: same as above, folded over a rotation period (![]() ). Bottom: periodogram showing the residuals of the fit as a function of rotation frequency (number of cycles per day). The horizontal dashed line correspond to the significance threshold (sigma-level, see text).
). Bottom: periodogram showing the residuals of the fit as a function of rotation frequency (number of cycles per day). The horizontal dashed line correspond to the significance threshold (sigma-level, see text).
Current usage metrics show cumulative count of Article Views (full-text article views including HTML views, PDF and ePub downloads, according to the available data) and Abstracts Views on Vision4Press platform.
Data correspond to usage on the plateform after 2015. The current usage metrics is available 48-96 hours after online publication and is updated daily on week days.
Initial download of the metrics may take a while.