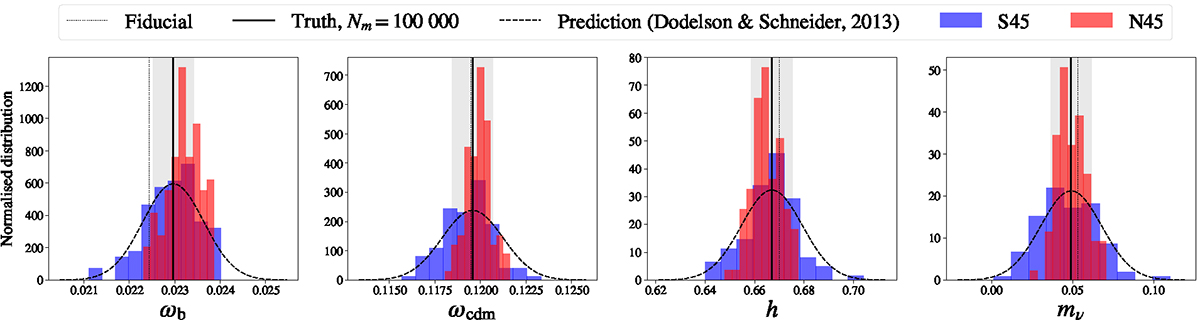
Fig. 8.
Download original image
Distribution of the estimated best fit on cosmological parameters ωb, ωcdm, h, and mν (from left to right) obtained for each of the 100 evaluations of the covariance matrix (Nm = 45) when considering the standard estimator S45 (blue histogram) or NERCOMEN45 (orange histogram). The black vertical line shows the best fit estimated with the true covariance matrix and its associated error represented by grey shaded area. The dotted vertical line referred to as fiducial in the inset displays the true cosmology. The dashed line represents a Gaussian centred on the true best fit which dispersion is given by the prediction of Dodelson & Schneider (2013) (c.f. Eq. (11)).
Current usage metrics show cumulative count of Article Views (full-text article views including HTML views, PDF and ePub downloads, according to the available data) and Abstracts Views on Vision4Press platform.
Data correspond to usage on the plateform after 2015. The current usage metrics is available 48-96 hours after online publication and is updated daily on week days.
Initial download of the metrics may take a while.